
Abstract
Retinal optical coherence tomography (OCT) has developed from a research tool to a validated instrument recommended for clinical use. For good clinical practice (GCP), this will require adherence to quality control (QC) criteria. This chapter will provide an overview of lessons learned from hands-on teaching of retinal OCT to a broad audience at a number of centers, both neurological and ophthalmological, and international teaching courses. The chapter will also highlight practical QC points as relevant to working together with a reading center for clinical studies and trials.
Access provided by Autonomous University of Puebla. Download chapter PDF
Keywords
Introduction
Spectral-domain optical coherence tomography (SD-OCT) has matured from a research instrument to a tool used in clinical routine [1–3]. The combination of OCT data with confocal scanning laser ophthalmoscopy (cSLO) or infrared (IR) has enabled all of us to take an image of the surface (cSLO/IR) and depth (OCT) of the retina, then sit down and talk about it. The axial resolution of commercial SD-OCT machines is in the 4–7 μm range. As you have learned from the previous chapter, a retinal ganglion cell (RGC) has a thickness of about 5–20 μm (see Table 2.1). Therefore SD-OCT does permit us to make observations on a quantitative scale that reaches the cellular level in individual retinal layers. In other words, SD-OCT permits the visualization of neurodegeneration in vivo at a hitherto unparalleled structural resolution. All you need to know is how to acquire the technical skills to do so. This is not only fun but also highly satisfactory, both in clinical care and in research.
How to Assess a Patient Using OCT
This section describes the three key factors relevant to obtaining a good OCT: a suitable environment, a comfortable patient, and a competent examiner.
The Setup
Create an examination situation in which the patient and you feel comfortable and confident. A relationship of mutual trust will help to obtain best results, particularly if unforeseen problems appear during the assessment.
A well-suited setup is an air-conditioned room with dimmable light levels. The air stream should not blow into the patient’s face in order to avoid dry eyes, which can cause frequent blinking during the OCT assessment. Position the patient and examiner so that both can best do their tasks. The patient should not be visually distractible and may therefore best face a wall. The examiner should be able to always keep an eye on the patient but will, in a busy work environment, also need to interact with colleagues. This can be achieved by the examiner facing the entrance to the examination room (Fig. 3.1). This setup also allows to minimize the effect of stray light to the patient’s eyes in case of an open entrance or incidental opening of the door. The OCT examination is best performed in a darkened room, particularly in patients in whom the pupils were not pharmacologically dilated.

The setup should allow for good OCT examination conditions. Patients may require wheelchair access and additional help during the assessment for which there needs to be sufficient space. Dimmable light permits the OCT examination to be performed in a darkened room. The effect of stray light from an open door/entrance should be minimized by positioning the patient and examiner appropriately. Allow for sufficient space on the examiner’s side too to permit teaching and technical help with challenging situations
To enable assistance to patients through a third person, provide sufficient space around the patient’s place. Finally, the examination room should have wheelchair access.
For teaching purposes allow sufficient space behind the OCT machine on the examiner’s side.
The Patient
The patient is in a vulnerable role. Their emotions may be influenced by the disease. Insecurity and anxiety may create challenges for a good assessment (Box 3.1). Reasons can be physical disabilities affecting mobility and communication but also bad experiences with past investigations. Building and maintaining trust is a good way to help overcome these issues.
Box 3.1
The main task for the patient is to fixate a small visual target during the examination, which requires keeping the eye, head, and body still.
Patients suffering from multiple sclerosis may have symptoms that can complicate the OCT assessment. These problems should be recognized prior to the OCT assessment. Some symptoms may require additional assistance and protocol modifications, which are best discussed prior to starting the assessment.
-
1.
Vision: inability to maintain visual fixation because of a central visual field defect, poor visual acuity, and/or nystagmus.
-
2.
Hearing: inability to follow auditory directions during the examination.
-
3.
Mobility: pathology affecting the cerebellar function and pyramidal and extrapyramidal systems may all make it difficult for a patient to sit comfortably throughout the OCT assessment and maintain a still head position.
-
4.
Cognition: impaired cognitive function may not only limit what a patient understands about the assessment and the ability to follow directions but also influence the patient’s behavior during the OCT assessment itself. Patients may be easily distractible, look around, keep talking, grow fidgety, or tire out during the assessment. Loss of praxic skills and higher visual functions pose a challenge too.
-
5.
Face, lid, and eye: anatomical constraints of the face may make it impossible for the OCT lens to be moved close enough the eye to obtain an OCT image. A ptosis of narrow palpebral fissure may require extra assistance. Makeup and long eyelashes may dirty the OCT lens. Small pupils (<2 mm) may require pharmacological pupil dilation; this may also be of help in some cases with opacities in the light pathway, such as cataract or floaters.
In general terms, the OCT assessment is relatively straightforward in patients suffering from multiple sclerosis compared to patients with movement disorders, dementia, rapidly progressive neurodegenerative disorders, or pathology causing impaired vision and blindness.
The Examiner
The role of the examiner(s) depends on the professional background. The examiner can be an OCT technician, physician, nurse, trainee, or student. A trainee will require teaching, both hands on and theoretical. An OCT technician may want to discuss medical questions potentially arising from certain images. A nurse or physician may require technical assistance. Therefore the position of the examiner should be clear to the patient.
Box 3.2
The task of the examiner is to obtain high-quality OCT data, which requires giving directions.
The examiner should be able to communicate in lay terms what the OCT assessment includes (Box 3.2). The examiner should be able to answer the patient’s question: “Will my eye be touched?” The examiner needs to give the appropriate instructions to aid the patient in maintaining visual fixation and keeping the eye, head, and body still. The examiner needs to recognize when extra assistance is needed for the patient. Likewise, an examiner needs to know when to call for help with OCT image acquisition, handling, and storage.
As a general rule, always explain to the patient what you want to do before you do it. Like with other paramedical tests, be very cautious about what you say to a patient with regard to the images just obtained. Your words may cause distress and harm. The errors of overreporting are likely to be greater than the errors of underreporting. There is no harm in asking for more time to discuss the images with your colleagues first.
The Machine
Common to all OCT devices on the market is that a light signal is focused through a lens to the retina. Next, light scattered back from the retina is captured by the same lens. Finally, the OCT image is composed with the aid of device-specific hardware and software. For brevity, this chapter takes examples predominantly derived from one SD-OCT device. There are differences between the many commercial devices, but the OCT market is developing so rapidly that it will not be possible to have an updated pragmatic chapter on all.
All one needs to do to obtain a good OCT image is to place the lens correctly. Practically, this is similar to the handling of a slit lamp. If you have never used a slit lamp or ophthalmoscope, think of the opening scene from a James Bond movie (Fig. 3.2).

A mnemonic aid for correct placement of the OCT light beam is the gun barrel sequence that features in almost every 007 film. The OCT light beam should enter the center of the pupil
Which OCT Do You Want to Own?
The OCT market is rapidly expanding. Both commercially developed and in-house-developed devices contribute to the data available. Access to in-house devices will remain exclusive to a few research centers. In contrast, the commercial sector has developed an impressive “shopping list,” which was recently reviewed by Fiona Costello [4]. Device-specific features for spectral-domain and swept-source OCT are reproduced and updated from reference [4]. At the time of writing, most literature on OCT in multiple sclerosis and optic neuritis is based on data from the Cirrus and Spectralis devices:
-
1.
Cirrus (Zeiss)™ combines advanced software features that enable good-quality scan acquisition. The FastTrac ™ option reduces eye motion artifacts. The Guided Progression Analysis™ permits for longitudinal comparison of retinal layer thickness changes. The FoveaFinder™ ensures that the Early Treatment Diabetic Retinopathy Study (ETDRS) grid is centered on the fovea. The AutoCenter™ centers the ring scans on the optic nerve head. Automated seven-layer segmentation is possible. Finally, HD-OCT technology enables sharing of data with networked review stations.
-
2.
The SPECTRALIS (Heidelberg Engineering) is a multimodality device combining the advantages of a confocal scanning laser ophthalmoscope (cSLO) with the benefits of achieving cross-sectional images of the retina with a spectral domain-based optical coherence tomography (OCT) module. Besides the standard infrared (IR)-based fundus image, the SPECTRALIS offers up to six different imaging modalities in the highest stage of expansion. The Multicolor™ feature combines three wavelengths (IR, green, blue) to generate a true detailed color fundus image, while the autofluorescence (Bluepeak™) allows the structural assessment of the retina as well as gathering metabolic information of the lipofuscin distribution in the retinal pigment epithelium (RPE), which is of relevance for ophthalmologic disease. Next, there is an option for fluorescence angiography (FA) and indocyanine green angiography (ICGA) in combination with a noncontact ultra-wide-field (UWF) lens peripheral angiography. The anterior segment (ASM) lens extends the capability to image the cornea, sclera, and chamber angles. An important feature is the active eye-tracking system (TruTrack™), which compensates involuntary eye movements and blinking at time of scanning without need for post-processing. This technique allows a precise point-to-point registration of the fundus image and OCT scan. Moreover, the eye-tracking system is the base for the rescan (AutoRescan™) function, which uses the baseline exam to place the follow-up exam on precisely the same position on the retina before acquiring the follow-up scan. This enables reliable longitudinal data. Recent software developments not only correct to circumvent rotatory problems (e.g., head tilt) but also adjust the scans individually on the retina. The so-called anatomic positioning system (APS) uses the center of the fovea and the Bruch membrane opening (BMO) as distinct reference points in the retina. Taking head tilt and cyclotorsion into account during acquisition allows for an individual classification of the scans. Finally there is the option for 11-layer segmentation on B-scans individually and as a batch as relevant for clinical studies.
-
3.
IVue (Optovue). Designed to be easy and fast, the machine includes a foot switch and touch screen. There is also the option for imaging of the anterior segment including corneal thickness measurements. Color-coded retinal layer segmentation and mapping includes the GCL, GCC, and the option for 3D “en face” visualization.
-
4.
Angiovue (Optovue). During the writing of this chapter, the first OCT device on the market to permit for 3D visualization of the retinal vasculature became available. This technology does not permit investigation for leakage, and the potential role for optic neuritis and multiple sclerosis remains to be seen. Possibly diseases like Susac syndrome or anterior ischemic optic neuropathy (AION) and paracentral acute middle maculopathy (PAMM) are of greater interest.
-
5.
3D OCT 1000/2000 (Topcon). Longitudinal image acquisition is possible, enabling comparison over time. Both 3D and 2D OCT viewing options can be combined with the fundus image (FastMap™ software). There is the option to manually pinpoint the location of an OCT image in the fundus image (Pin-Point™). Images are viewed through the EyeRoute® Image Management System.
-
6.
DRI OCT Atlantis (Topcon). A very quick swept-source OCT with follow-up function. Has the advantage of invisible scan lines, which makes it easier for the patient to focus on the target. A large 12 mm-wide screen for scanning. Automated 7-layer segmentation.
-
7.
OCT/SLO (Optos). It is possible to combine SLO and retinal tracking before, during, and after acquisition of the OCT scan. Registered follow-up is possible with the SLO “Lock and Track” function. There is the option to align 3D topographies to the SLO image, which permits correction for artifacts due to rotation and shift. Longitudinal comparisons, including retinal thickness, is possible with aid of the “Auto – Compare” feature. All images can be viewed remotely using the “Viewer Software.”
-
8.
Copernicus HR (Optopol Technology). Longitudinal image comparison possible. Option for 3D visualization and volume maps. There is a disk damage likelihood scale (DDLS) for the optic nerve, which is based on the rim/disk (r/d) ratio and optic nerve size. Imaging of the anterior segment is possible at a 3 μm resolution. Remote viewing of images from a central database is possible.
-
9.
Canon OCT HS-100. Longitudinal imaging is possible using SLO tracking of retinal images. Option for enhanced depth imaging of the choroid. Option to import retinal camera images, which then can be aligned and overlayed with the SLO image. Ten-layer retinal segmentation.
-
10.
RS-3000 (Nidek). Longitudinal imaging using multifunctional follow software is possible for this SD-OCT device, which enables averaging up to 120 images. Option for selectable OCT sensitivity aids improved visualization with a range of ocular pathologies. Eye-tracking capabilities including torsion. Reports can be customized.
Infrared (IR) and (Confocal) Scanning Laser Ophthalmoscopy (c)SLO
There are two options: an IR camera or a scanning laser ophthalmoscope (SLO). The SLO scans the image line per line, similar to how old-fashioned television screens used to build up an image. In most devices this is a bit slower than the IR camera (about 16 images per second compared to 24 images per second), but scanning speeds can be increased. The speed of both IR and (c)SLO enables video recording. One advantage of the SLO and confocal SLO (cSLO) images is the high resolution. Taken together, the image quality of (c)SLO is better than for IR. In (c)SLO there is a small depth of focus and scattered light is better suppressed. Therefore patients find (c)SLO more comfortable (less bright light exposure). There are good 3D imaging capabilities. Finally, imaging with smaller pupil sizes becomes possible.
IR
IR is used by the following OCT devices: Stratus, 3D OCT 2000, iVue, and Copernicus HR. (c)SLO is used by Spectralis, Cirrus, DR 1, RS-3000, OCT SLO, and Canon OCT HS-100.
Pupil Size Requirements
A preference in a neurological clinic is not to dilate the pupil pharmacologically. In most patients it will be possible to obtain good-quality OCT scans without the need to dilate the pupil. The pupil size should be measured at the same light level at which the OCT images will be acquired. At time of writing, the following pupil size requirements apply:
-
≥2 mm: Spectralis, Cirrus
-
≥2.5 mm: 3D OCT, DR 1, RS-3000
-
≥3 mm: iVue, OCT SLO, Copernicus HR, Cannon OCT HS-100
-
≥3.2 mm: Stratus
Light Source
The axial resolution of OCT is related to the bandwidth of light. A finer axial resolution is achieved with a wider span of wavelengths in the light. The current light source range is 820–1050 nm.
-
820 nm: Stratus
-
830 nm: OCT SLO
-
840 nm: Cirrus, 3D OCT 2000, iVue
-
850 nm: Copernicus
-
855 nm: Canon OCT HS-100
-
870 nm: Spectralis
-
880 nm: RS-3000
-
1050 nm: DR 1
Resolution
For all devices the axial resolution (3–10 μm) is better than the transverse resolution (12–20 μm). The reported axial resolution is:
-
3 μm: Canon OCT HS-100, Copernicus HR
-
5 μm: Cirrus, iVue
-
6 μm: 3D OCT 2000
-
7 μm: Spectralis, RS-3000
-
8 μm: DR 1
-
10 μm: OCT SLO, Stratus
Scanning Speed
The number of A-scan obtained per second determines the scanning speed. High scanning speed reduces the likelihood of motion artifacts. Scanning speed will become more and more important with the advance of Doppler OCT. The exquisite images of the retinal vasculature obtained by, for example, the Angiovue is only possible due to the high scanning speed of 70,000 A-scans/s. At time of writing, scanning speeds are:
-
400 A-scans/s: Stratus
-
25,000 A-scans/s: iVue
-
27,000 A-scans/s: Cirrus
-
40,000 A-scans/s: Spectralis
-
50,000 A-scans/s: 3D OCT 2000
-
52,000 A-scans/s: Copernicus HR
-
53,000 A-scans/s: RS-3000
-
70,000 A-scans/s: Angiovue, Canon OCT HS-100
-
100,000 A-scans/s: DR 1
Basic OCT Protocol
As a minimal requirement, one needs to capture (1) the area where all axons leave the eye, the optic nerve head, and (2) the area most relevant for our vision, the macula. A basic OCT protocol therefore comprises a volume scan of the macula and optic nerve head. Some patients with MS will have difficulties maintaining the visual fixation needed to acquire a good-quality volume scan. A volume scan may take too long for these patients. Therefore if speed matters, a ring scan around the optic nerve head may be used instead of the volume scan. The basic OCT scan protocol, which should be possible in most patients with MS, is summarized in Fig. 3.3.

Basic OCT protocol for patients with MS. (a) Ring scan of the optic nerve head and (b) volume scan of the macula
Start OCT Scan
This section was written for the Spectralis device (Fig. 3.4) and reproduced from reference [5]. For other devices the reader is referred to the device-specific instruction manuals.

Heidelberg Spectralis OCT
-
1.
First, prepare the software by entering the patient details into the database. In case of a follow-up examination, a patient record will already have been created and you will only need to specify the OCT operator taking the image.
-
2.
Second, prepare the hardware. (1) Pull the OCT camera head back, (2) clean the parts coming in contact with the patient (forehead and chin rest), (3) remove the lens cap and wipe the lens if not clean, (4) adjust the height of the table to a comfortable position for the patient, (5) adjust the height of the patient’s head so that the marker indicating the canthus (Fig. 3.4) comes to the patient’s eye, and (6) ask if the patient is ready to go or if there are any questions. The patient should already know that the eye will not be touched.
-
3.
Third, start the OCT acquisition window. There will be a short device calibration period before you can click on the yellow square to the bottom right of the screen to start imaging. Now the cSLO image will appear in the window to the left of the screen. A few seconds later, the OCT signal will be seen in the window to the right of the screen.
-
4.
Fourth, repeat explaining to the patient that a fixation target will appear. This is a blue light. Some patients will see a series of vertically displaced blue lights for optical reasons. In this case ask them to look at the brightest one, which typically is the bottom one. Some patients will not be able to see the internal fixation target. If this is the case, (1) use the external fixation target consisting of a lamp, (2) use your finger (or alternative) as a target, or (3) give verbal instructions where to look (right, left, up, down). Be aware that good visual fixation will help to get quick and high-quality OCT images. Patients are permitted to blink and move eyes in between for their own comfort. A teary dry eye is no good for OCT imaging.
-
5.
Fifth, in the acquisition window select “Axonal.” The advantage of the axonal setting is that it was developed specifically for neurological conditions. The OCT B-scan lines are orientated vertically, which permits capture of all axons cross-sectionally.
-
6.
Now you are ready to choose from the “Preset” buttons. For a basic protocol, you will only need the macular volume scan and ring scan. It is your choice which one you start with. My personal preference is to start with the macular volume scan because the patient finds it easier to fixate.
The Macular Volume Scan
-
1.
First, click on one of the macular volume scans from the preset buttons. Scans with a low ARTFootnote 1 (e.g., 9) are quicker than scans with a high ART (e.g., 40–100) and better suited to detect small microcysts but less suited for high-quality retinal layer segmentation. A high ART takes longer and may be less suited for patients with difficulties to maintain visual fixation or to sit comfortably for long in the required position.
-
2.
Second, use the “007 technique” (Fig. 3.2) on the cSLO to get the retina in focus. The OCT image will appear once you have advanced the OCT camera head close enough to the patient’s eye. If the OCT image “flips over” on the top of the screen you will need to move the camera a bit back again. Do not touch the eye.
-
3.
Third, once you have a good cSLO image and OCT signal, activate the device-specific “Eye-Tracker.” To do so, you need to either (i) press the joystick button for about 2 s (basic Spectralis device) or (ii) press the round button below the touch screen (all other Spectralis devices).
-
4.
Fourth, place the volume scan with the mouse over the macula.
-
5.
Fifth, once you start scanning by either (a) pressing the joystick button shortly or (b) pressing the “Acquisition” button on the touch screen, make absolutely sure to observe the OCT live image to the bottom of the screen. Always keep the scan as much horizontally aligned as you can. While the device is acquiring several images to obtain a good signal-averaged image, you may need to continue adjusting the live image with tiny up/down/right/left movements of the joystick.
-
6.
Once the image is complete, continue with the ONH ring scan.
The ONH Ring Scan
-
1.
First, click on “RNFL-N” (indicating the ONH ring scan) from the preset buttons. Adjust the ART according to the patient’s abilities and image post-processing needs. Higher ART means longer scanning time.
-
2.
Second, ask the patient to fixate on the new target, which is now closer to her nose.
-
3.
Third, once the ONH is clearly visible in the cSLO window and there is also a good OCT signal, start the device-specific “Eye-Tracker” function as described previously.
-
4.
Fourth, place the ring scan around the ONH using the mouse drag-and-drop option. Note that the ring scan needs to be well centered [6, 7]. Also use the mouse to move the blue line on the cSLO image over the foveola.
-
5.
Fifth, start the OCT image acquisition by pressing the device-specific button as described earlier.
Advanced OCT Protocol
Advanced options help to increase anatomical information and modification of imaging modalities.
From an anatomical perspective, the ONH is particularly interesting. There is a large anatomical variation of the ONH between subjects. Principally, an ONH volume scan (Fig. 3.5) is best suited to capture this and also permits for image post-processing including extraction of a ring scan and analysis of the lamina cribrosa where myelination of the optic nerve axons starts. An option in between a very fast ring scan and a longer volume scan is an ONH star scan (Fig. 3.6). Either scan combined with the EDI function may permit capture of the lamina cribrosa. For comparison, the EDI function was enabled in Fig. 3.5, but not in Fig. 3.6. Consequently the lamina cribrosa is captured better in the former.

An ONH volume scan with EDI enabled. The cSLO image of the retina is shown in pseudo-colors and the OCT image in grey. This 3D image was constructed of n = 73 vertical B-scans. Anatomical landmarks are indicated: CRA central retinal artery, CRV central retinal vein, RNFL retinal nerve fiber layer

An ONH star scan without EDI. Compared to the volume scan, the star scan is quicker due to the lower number of B-scans (n = 24), which are acquired at different angles
The nerve fibers of the so-called papillomacular bundle (PMB) are more vulnerable compared to other axons in the retina [8]. The diameter of axons in the PMB is only around 0.4 μm but up to 2.5 μm fibers elsewhere in the retina [9]. There is an option to scan for the approximate area of the PMB (Fig. 3.7). But because there is no exact anatomical definition to the extent and course of the PMB [10], an ONH volume scan, together with a volume scan of the area projecting from the ONH to the macula (Fig. 3.7), might be valuable.

A volume scan placed over the area between the foveola and ONH, which captures part of the papillomacular bundle (PMB). This is a high-resolution scan of n = 105 B-scans. A circular artifact is seen to the middle of the cSLO image due to a light reflex
From an image modality perspective, autofluorescence (Fig. 3.8) is interesting in a clinical neuro-ophthalmology setting but has, to the best of my knowledge, not yet delivered any valuable information in MS. Likewise, there are options for multicolored laser beams in the cSLO image (Fig. 3.9) that to date do not add to the investigation of patients with MS. In contrast, the option to perform fluorescence angiography is relevant and will be of value in a subset of patients with possible optic neuritis to determine leakage. Recent developments include so-called Doppler OCT, which makes use of image motion information during acquisition. Essentially, this represents a conceptually diametrically opposed paradigm to classical OCT image acquisition, which tries to average only structurally stable parts of the retina. Blood vessels pulsate and move and thus angio-OCT permits detection of the retinal vasculature. A predicted shortcoming is that angio-OCT will not show leakage from the retinal vasculature.

Autofluorescence (AF) of the fundus revealing buried optic disk drusen

Multicolor cSLO
Another interesting option is the use of polarization-sensitive OCT (PS-OCT). It was proposed to test if change of birefringence in the RNFL precedes loss of RNFL [2]. The underlying pathological mechanism is thought to reflect on change of the most abundant structural protein of the axon: neurofilaments. Mechanisms described in MS are neurofilament aggregate formation, posttranslational modifications (phosphorylation, nitrosylation, glycosylation), and proteolysis. There may be a role for tubulin too; but because tubulin proteins are expressed in almost all cell types [11], data are likely to be contaminated unless obtained in a cell-type-specific cell culture model. Credit really goes to Mark Kupersmith who was first to make use of the clinically most suited model to test such a hypothesis: anterior ischemic optic neuropathy (AION), where the onset of symptoms is well defined and the outcome definite [12]. Reproduction of these data, which were acquired with scanning laser polarimetry, with PS-OCT will be informative. If indeed PS-OCT signal change can be related in translational studies to proteomic data, such as neurofilament phosphorylation and aggregate formation as an early sign of axonal pathology, then it might be possible to test neuroprotective treatment options that may reverse damage to proteins prior to axonal loss occurring.
Retinal Layer Segmentation
There is no doubt that the development and validation of algorithms for segmentation of retinal layers has risen to the top of the image post-processing agenda. Automated segmentation will be relevant to acquire quantitative normative data for individual data that will inform on layer-specific pathology. For multiple sclerosis the most relevant layers to assess neurodegeneration are the RNFL, GCL, IPL, and potentially the INL. The latter two can be segmented individually but are sometimes presented jointly as GCIP (see Chap. 9 by Paul and Brandt in this book). The advantage of the macular GCL is that optic disk edema does not mask onset and progression of atrophy. This is interesting for longitudinal monitoring of patients with multiple sclerosis and optic neuritis [3, 13].
Recognize Common Pitfalls
My experience with quality control reading in clinical trials and investigator-driven studies is that there are only very few common technical mistakes and most issues relate to adherence to the manual and scanning protocol(s). Therefore a slightly patronizing advice is to only go ahead if the answer to the following three questions is “yes”:
-
1.
Is the patient comfortable and correctly positioned?
-
2.
Can the patient fixate?
-
3.
Do you know which protocol to run?
Then there are common pitfalls, which can be minimized by following the “do’s” and avoiding the “don’ts”:
-
1.
Three “do’s” to remember:
-
(a)
Keep the ring scan still while the averaging (ART) is ongoing, and only press the button to acquire the image after averaging is complete (horizontal bar under ART).
-
(b)
Most people are good in getting the first scan well aligned. But please keep an eye on the live imaging window during acquisition of the volume scan. A volume scan is composed of a number of B-scans. Make sure that you do not inadvertently “cut off” subsequent B-scans by either moving the camera too much or not at all.
-
(c)
Keep the scan horizontally aligned in the live image window. If this should not be possible, please make sure that you keep the direction of the tilt on subsequent scans. This is particularly relevant for the ring scans.
-
(a)
-
2.
Three “don’ts” to remember:
-
(a)
Do not be trigger active. Premature pressure of the acquisition button will result in low-quality images such as illustrated in Figs. 3.10, 3.11, and 3.12.
Fig. 3.10 
A good-quality baseline OCT is shown on the top as a reference scan. For the follow-up, the operator was “trigger active” and acquired the OCT scan before sufficient averaging was done. Another QC problem with this ring scan is that it was not well centered. This scan does fail QC
Fig. 3.11 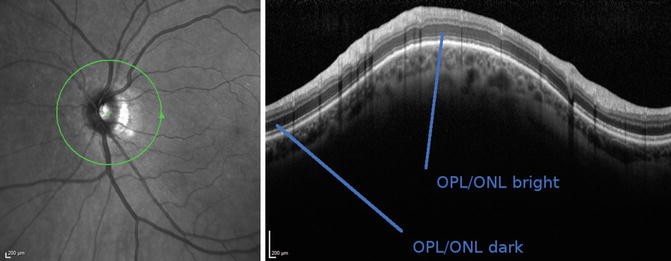
During acquisition of this ring scan, the OCT laser beam was not centrally placed. Consequently the OCT image, typically seen in the live imaging window, appears as a curved line. This is always associated with the OPL/ONL sign [14]. Both layers are inhomogeneously illuminated
Fig. 3.12 
Artifactual peripapillary RNFL thinning in a subject with −8 diopters myopia in both eyes. A myopic crescent can be seen on the cSLO images. There is a cilioretinal artery in the left eye
-
(b)
A cutoff B-scan as shown in Fig. 3.13.
Fig. 3.13 
This ring scan taken at follow-up was partly cut off. No data can be calculated for the nasal sector. This scan does not fulfill QC criteria
-
(c)
A scan with poor illumination that is also not horizontally aligned in the live window (seen as a change of the signal intensity of the OPL/ONL) as illustrated in Fig. 3.14 [14] and Fig. 3.11. If this is the only scan you can get, do not change the position of the measurement beam (seen as a change of the OPL/ONL signal) on subsequent visits.
Fig. 3.14 
An unequally illuminated OCT volume scan due to poor scanning technique. This scan should be QC rejected
-
(a)


Implement Quality Control (QC)
The rationale for implementation of quality control is that the small degree of retinal layer atrophy caused by neurodegeneration can easily be masked by artifacts [6, 15]. To be able to separate one from the other, implementation of QC is mandatory.
Atrophy Measures Are Influenced by QC Issues
As already stated, the annual atrophy rate of the peripapillary RNFL in MS is about 1–2 μm per year compared to about 0.1 μm in healthy individuals, based on time-domain OCT data on a group level [16]. Using spectral-domain OCT data and advanced retinal layer segmentation, an annual atrophy rate of 1.1 μm was shown for the peripapillary RNFL and a matching 1.1 μm for the macular ganglion cell complex (GCL and IPL) [17].
In a clinical setting seeing individual patients, the question might arise if any atrophy had occurred since the last visit. Figure 3.15 illustrates two subsequent scans from one subject taken 1 year apart. Clearly, the bold black line taken at follow-up suggests 12 μm atrophy of the peripapillary RNFL. But closer inspection demonstrates a change of signal intensity in the OPL/ONL (blue lines). This is a well-known measurement artifact due to tilted OCT measurement beam placement [14]. Therefore it would be wrong to report progressive atrophy in this particular case.

In this 45-year-old man with a 19-year history of MS, the follow-up OCT ring scan (top of image) suggests a localized loss of the RNFL in the papillomacular bundle of around 12 μm (blue circle) over the past 2 years. This is clearly more than what would be expected from aging alone. Comparison of the OCT B-scan at baseline (red square, 26-MAR-2012) and follow-up (16-MAY-2014) shows change of signal intensity in the OPL/ONL. This is caused by change of the OCT measurement beam pathway and the reason for artifactual PMB thinning. This patient never had an episode of MSON
Other recognized artifacts include displacement of the peripapillary ring scan (over 3.4 μm) [18] and poor signal quality (around 10 μm) [19].
On a group level, as relevant to clinical trials and cohort studies, one needs to realize that the small degree of atrophy in neurodegeneration can easily be masked by preventable artifacts. A set of internationally validated QC criteria emphasize seven key points that require attention [7].
OSCAR-IB
Mnemonics were chosen to remember the seven key QC points for retinal OCT scans, OSCAR-IB [6, 7]. These criteria were originally developed for the peripapillary ring scan but equally apply to volume scans [20]. These criteria are summarized in Table 3.1 [6] and will be discussed one by one in the following seven sections:
O Criterion
Obvious reasons leading to QC failure are protocol violations. Like with a photograph, an optically sharp image is required. So failure to focus the image causes QC failure. Other causes encountered are a dirty lens, obscurations in the optical pathways (lens opacities, vitreous hemorrhage, or a strong cellular reaction in the anterior segment), and a very small pupil size (<2 mm for most current devices). Software issues include a lack of averaging of OCT B-scans either because the averaging mode was turned off or because the OCT images were taken too quickly (“trigger active”). An example for an OCT scan that was cut off is shown in Fig. 3.13. Such a scan will fail QC.
S Criterion
The signal strength needs to be sufficient for a good-quality OCT B-scan with appropriate contrast between layers as required for image post-processing. The signal strength required can vary. For segmentation of the RNFL from a young healthy eye, the signal strength required will be lower if compared to what is needed for segmentation of the outer retinal layers from an elderly patient with cataract- and age-related macular degeneration. As a rule of thumb, if one is able to visually distinguish the different retinal layers in the averaged OCT image, the signal is sufficient. Usually an OCT scan fails QC for the S criterion not in isolation but because algorithm failures (A criterion) also follow. Figure 3.16 shows an example of a poor signal strength OCT. This example highlights that QC criteria, originally thought to be relevant for the RNFL, will be even more relevant for the widespread use of segmentation algorithms.

This poor signal strength OCT gives rise to a grainy and noisy image with associated algorithm failures for several layers. (a) The OCT B-scan at baseline and (b) follow-up. Clearly there is a difference in contrast between retinal layers. Following automated segmentation (c) at baseline and (d) follow-up, artifactual differences in layer thicknesses are suggested. The artifactual change of individual retinal layer thicknesses is shown for (e) the RNFL (maximal error 34 μm, indicated by green reference line), (f) the GCL (maximal error 46 μm, indicated by green reference line), (g) the INL (maximal error 73 μm, indicated by green reference line), and (h) the ONL (maximal error 58 μm, indicated by green reference line)
C Criterion
Correct centration of a ring or volume scan is relevant, too. In a clinical setting, a poorly centered ring scan can make it impossible to see whether or not there is relevant RNFL loss. Figure 3.17 shows the ring scan taken from a patient with MS. It is impossible to say from this scan if there was any loss of RNFL in the PMB. This ring scan was placed too close to the temporal/superior optic disk margin. Such a loss was clinically anticipated because of persistent poor color vision following an episode of MSON, implying pathology of the parvocellular projections [21].

This ring scan was not well centered. Consequently RNFL thickness values cannot be compared to the normal range (green-shaded area). This scan is also poorly focused (O criterion). This scan fails QC
On a group level, even a small degree of displacement may introduce a measurement artifact of more than 3.4 μm for the RNFL [18].
Likewise poor centration of the macular volume scan over the foveola causes artifactual retinal thickness maps. Figure 3.18 illustrates this in one clinical case with MSON. In some cases it may still be possible to manually readjust for measurement areas, such that at least part of the data can be used. If the misplacement was too extreme, even image post-processing may fail.

This macular volume scan was placed too far to the left. (a) The EDTRS grid was not centered over the foveola. This led to an artifactual macular thickness map for the GCL (between bluish and purple lines in OCT). (b) Manual replacement of the EDTRS grid still permits for these scan data to be used. The OCT B-scan now shows that the center of measurement is placed well within the foveola. The small black/white square placed over the foveola in the cSLO image is a marker used as a reference. Quantitative data from this marker is shown in the red framed box to the upper right in (a) and (b)
Note that re-centration by image post-processing may be possible for the macular scan, which consists of many OCT B-scans, but not for the ring scan of which there is only one. In a clinical setting, this may be relevant for choice of OCT image protocol in patients with poor fixation. A quick large area volume scan might be preferred over a ring scan to increase the chance to cover the relevant area.
A Criterion
Reasons for algorithm failures are a poor signal strength, poor illumination, retinal pathology, inconsistent OCT beam placement, and blood vessel artifacts, to name but a few. Figure 3.19 shows an algorithm failure due to the presence of an epiretinal gliosis. Such an error can be manually corrected by image post-processing. In a clinical setting, it is always advised to visually inspect if the RNFL was segmented correctly. Blindly relying on values can lead to misinterpretation. In the case shown, there was a significant degree of atrophy that could easily have been overlooked.

(a) Algorithm failure due to presence of epiretinal gliosis (vertical green reference line). This shows a 34-year-old man with a diabetes mellitus type 1 and diabetic retinopathy for which he received laser treatment (white spots on cSLO image)
For clinical trials and cohort studies, most algorithm failure can almost always be corrected at a later stage if the other OSCAR-OB QC criteria are met.
R Criterion
Presence of retinal pathology which can influence retinal layer thickness measurements can introduce a bias into the data. Therefore retinal pathology needs to be carefully excluded, particularly for cross-sectional studies comparing groups. A typical example for an MS clinic might be presence of myopia. In subjects with severe (>6 diopters) myopia, the elongation of the eyeball leads to RNFL thinning. This is illustrated in Fig. 3.12. Conversely there might be artifactual RNFL thickening in a subject with hyperopia or presence of drusen. In some cases hyperopia can be misinterpreted as papilledema.
A list of retinal pathology that can effect retinal layer thickness measurements and therefore requires to be considered is given in Table 3.2 [6]. The risk for bias due to retinal pathology might be less in longitudinal studies that consider change of retinal layer thickness over time compared to cross-sectional studies.
I Criterion
Poor illumination of poor signal go frequently, but not always, hand in hand. Poor illumination can be an image that is either generally too dark or unequal. Illumination was embraced as one of the first QC criteria in the ophthalmological literature [15]. An unequally illuminated image is shown in Fig. 3.14. As can be seen, there is a drop of signal in the poorer-illuminated areas and algorithm failures follow. In a clinical setting, it is always worthwhile remembering that floaters are a frequent cause for entoptic phenomena and can also be the root for unequal illumination as they cast shadows (Fig. 3.20).

An unequally illuminated OCT volume scan due to a floater. The floater can be seen casting a shadow in the cSLO image and in the OCT B-scan. This scan should be QC accepted
B Criterion
Finally, there is one artifact that is not readily recognized: the influence of the light pathway. The easiest way to avoid this error is to always keep the OCT B-scan in the live image horizontally aligned.
To understand the B criterion, it is best to try it out by performing an OCT scan to oneself or watching the online provided as supplementary data from reference [14].
If the measurement beam is horizontally or vertically displaced, the OCT B-scan appears to be wavy (Fig. 3.21) [14]. Localised measurement artifacts due to poor beam placement are in the range of 9–40 μm for the peripapillary RNFL. Likewise data from the macular are affected by off-center beam placement [22]. Therefore recognition of this error is relevant in a clinical setting to avoid data misinterpretation, which might influence patient management. Likewise clinical trials and cohort studies will need to carefully QC check their longitudinal data for the B criterion.

Off-center placement of the OCT measurement beam results in tilted images. Here we show the OCT live image obtained by the optic nerve head ring scan. (a) The reference scan with the measurement beam (yellow dot) being placed centrally in the pupil (black circle). This results in a correct, horizontal OCT live image. Note: the live image will not be visible to the reading center (note that the live image was taken as a screenshot during the imaging and appears in print in lower quality than in reality. Please see Video 3.1 in the supplementary material for a live coverage image acquisition). (b) Temporal off-center placement of the measurement beam results in a centrally convex live image. (c) Nasal off-center placement results in a centrally concave OCT live image. (d) Rostral off-center placement results in a rising wave, which is mirrored by (e) caudal off-center placement (a falling wave). Please note that for didactic purposes the off-center placement of the measurement beam is shown for an idealized situation with a central fixation target for a perfectly aligned right subject’s eye from the OCT operator’s point of view (Image reproduced with permission from Balk et al. [14])
A simple sign that can alert to change of measurement beam placement between two examinations is the signal intensity of the OPL/ONL. This is shown in Fig. 3.22 [14].

Inhomogeneous reflectivity of the outer part of the ONL indicates off-center placement of the OCT measurement beam. (a) The averaged summary scan obtained from the correctly, horizontally orientated live images of the reference scan. This image shows a homogeneous reflectivity of the outer ONL (black arrow). The automated segmentation identifies the borders of the RNFL (red/gray lines). Note: this is the image that is sent to the reading center and used for automated calculation of the RNFL thickness. (b) Temporal off-center placement results in an inhomogeneous outer ONL reflectivity. The ONL reflectivity is increased for the centrally elevated part in the live image (white arrows) and decreased in the periphery (gray arrows). (c) Nasal off-center placement. (d) Rostral off-center placement. (e) Caudal off-center placement (Image reproduced with permission from Balk et al. [14])
Concluding Remarks on OSCAR-IB
The mnemonic was chosen to help the OCT operator in preparing scan acquisition. Make sure to follow the right protocol with appropriate B-scan averaging and have a well-focused image (O).
While scanning, ensure that the ring and volume scans are well centered over the area of interest (C). Take care that the image is sufficiently bright and equally illuminated (I). Have the OCT scan horizontally aligned in the live window (B).
After the scan is completed and the patient is still present, check for presence of algorithm failures (A) and relevant retinal pathology (R). In some cases immediate re-imaging will be helpful. In a clinical setting, this may be relevant for following up on retinal pathology. In a clinical trial setting, this will prevent the undesirable situation to have to call a patient back, because a reading center does not accept OCT scans that fail QC (see chapter 13).
On a practical level, these straightforward, transparent, and validated QC criteria [6, 7] are best implemented by training and auditing team and service.
Train Your Team
It might not be possible or desirable to scan all patients yourself in a busy neurological outpatient clinic. Most teams have trained OCT operators who can have a wide educational background, frequently with some knowledge of retinal photography.
Training involves letting people make mistakes. Once an OCT operator understands how to reproducibly make a certain mistake, for example, with the B criterion, such a mistake will more readily be recognized in a real-life setting.
Next to obtaining good-quality OCT scans, it is necessary to have a complete set of scans. If a protocol contains only a ring scan and a macular volume scan, recognition of other pathologies should trigger further, more appropriate scans.
To give one example, optic disk drusen may give rise to pseudopapilledema (Fig. 3.23a). An apt operator who then performs an optic nerve head volume scan (Fig. 3.23b) and autofluorescence (Fig. 3.8) will add valuable information to clinical decision-making.

Artifactual RNFL thickening in presence of optic disk drusen. (a) ONH ring scan and (b) ONH volume scan. Drusen are indicated by the arrow
Little can be more annoying than to realize that a patient will need to be called back because an incomplete series of scans was acquired. In a clinical trial setting, this will inevitably lead to rejection from an OCT reading center (see chapter 13). In clinical practice, there might be a failure to recognize relevant pathology. In practice, a simple checklist helps to make sure that all relevant scans are done. An example for such a checklist is given in Fig. 3.24.

Patient scan checklist
Audit Your Service
There are good reasons to regularly check if a clinical service provided delivers what it is supposed to deliver. As with all other paraclinical tests, the OCT is an extension of the clinical judgment. Clinicians generally have an idea what they want to see on the OCT image, even if they are not familiar with all the details of the different OCT machines. Independent to what OCT device is used, the images need to be of an acceptable quality. Longitudinal monitoring of patients will require appropriate use of follow-up functions. Do the OCT images obtained have an influence on clinical decision-making? This can be reassurance about a suspected pathology but also redirect the diagnostic workup to a different pathology. Were all OCT requests made necessary? These parts of the general workflow can be assessed in an audit.
A first-level audit frequently will have to deal with quality control issues and training of personnel. At different institutions, the initial quality control failure rate may be unexpectedly high. This does not need to come as a surprise because many departments will have made use of OCT as an instrument to discover rather substantial levels of pathology. The need for highly accurate OCT imaging as relevant for assessment of neurodegeneration would not necessarily have been part of OCT operator training. The outcome of a first-level audit is likely to result in a team discussion and additional training.
Permit for sufficient time for improvements to consolidate. Next, implement an audit circle.
A reaudit will show if these measures have contributed to improving the overall quality of scans. People will have gained more experience and new ideas that may materialize in on-site protocols or standard operating procedures (SOPs). The outcome of a second-level audit may then be how to smooth the workflow, to optimize access to OCT scan results including use of remote viewing stations and to streamline OCT reporting.
Another reaudit at this stage should enable to assess the impact the OCT scans have on clinical decision-making and patient management. This will be important, because of the rapid development of technology, to help with the careful use of resources and potentially to contribute to developing and refining the clinical questions asked.
Conclusion
Retinal OCT has developed from a research tool [1, 2] to a validated tool recommended for clinical use [3, 13]. But good clinical practice will require adherence to QC [23, 6, 7, 20]. This chapter provided an overview of lessons learned from hands-on teaching of retinal OCT to a broad audience at a number of centers, both neurological and ophthalmological, and international teaching courses.
Notes
- 1.
ART stands for averaging of scans. The averaging algorithm takes eye movements into account. A “smoother” but not always necessarily “better” OCT B-scan will be obtained with a high ART number.
References
Frohman E, Costello F, Zivadinov R, et al. Optical coherence tomography in multiple sclerosis. Lancet Neurol. 2006;5:853–63.
Petzold A, de Boer JF, Schippling S, et al. Optical coherence tomography in multiple sclerosis: a systematic review and meta-analysis. Lancet Neurol. 2010;9:921–32.
Saidha S, Calabresi PA. Optical coherence tomography should be part of the routine monitoring of patients with multiple sclerosis: yes. Mult Scler. 2014;20:1296–8.
Costello FE. Optical coherence tomography technologies: which machine do you want to own?”. J Neuroophthalmol. 2014;34(Suppl):S3–9.
Petzold A. Optical coherence tomography to assess neurodegeneration in multiple sclerosis. Methods Mol Biol. 2014;153 ff. doi:10.1007/7651_2014_153
Tewarie P, Balk L, Costello F, Green A, Martin R, et al. The OSCAR-IB consensus criteria for retinal OCT quality assessment. PLoS One. 2012;7, e34823.
Schippling S, Balk L, Costello F, et al. Quality control for retinal OCT in multiple sclerosis: validation of the OSCAR-IB criteria. Mult Scler. 2014;21(2):163–70.
Uhthoff W. Untersuchungen über den Einfluss des chronischen Alkoholismus auf das menschliche Sehorgan. Archiv für Ophthalmologie. 1886;32:95–188.
Ogden TE. Nerve fiber layer of the primate retina: morphometric analysis. Invest Ophthalmol Vis Sci. 1984;25:19–29.
Plant GT, Perry VH. The anatomical basis of the caecocentral scotoma. New observations and a review. Brain. 1990;113(Pt 5):1441–57.
Petzold A. CSF biomarkers for improved prognostic accuracy in acute CNS disease. Neurol Res. 2007;29:691–708.
Kupersmith MJ, Anderson S, Durbin MK, Kardon RH. Scanning laser polarimetry, but not optical coherence tomography predicts permanent visual field loss in acute non-arteritic anterior ischemic optic neuropathy. Invest Ophthalmol Vis Sci. 2013;54:5514–9.
Petzold A, Wattjes MP, Costello F, et al. The investigation of acute optic neuritis: a review and proposed protocol. Nat Rev Neurol. 2014;10:447–58.
Balk LJ, de Vries–Knoppert WAEJ, Petzold A. A simple sign for recognizing off–axis OCT measurement beam placement in the context of multicentre studies. PLoS One. 2012;7(11), e48222.
Domalpally A, Danis RP, Zhang B, et al. Quality issues in interpretation of optical coherence tomograms in macular diseases. Retina. 2009;29:775–81.
Talman LS, Bisker ER, Sackel DJ, et al. Longitudinal study of vision and retinal nerve fiber layer thickness in multiple sclerosis. Ann Neurol. 2010;67:749–60.
Balk L, et al. Retinal ganglion cell injury in MS occurs most rapidly early in the course of disease. Multiple Sclerosis J. 2014;20(S1):PS8.3.
Gabriele ML, Ishikawa H, Wollstein G, et al. Optical coherence tomography scan circle location and mean retinal nerve fiber layer measurement variability. Invest Ophthalmol Vis Sci. 2008;49:2315–21.
Balasubramanian M, Bowd C, Vizzeri G, et al. Effect of image quality on tissue thickness measurements obtained with spectral domain-optical coherence tomography. Opt Express. 2009;17:4019–36.
Petzold A, Balcer L, Calabresi P, et al. OCT in a multi–centre setting: quality control issues. In: Calabresi P, Balcer L, Frohman E, editors. Optical coherence tomography in neurological disease. New York: Cambridge University Press; 2015. p. 103–13.
Evangelou N, Konz D, Esiri MM, et al. Size-selective neuronal changes in the anterior optic pathways suggest a differential susceptibility to injury in multiple sclerosis. Brain. 2001;124:1813–20.
Hariri A, Lee SY, Ruiz-Garcia H, et al. Effect of angle of incidence on macular thickness and volume measurements obtained by spectral-domain optical coherence tomography. Invest Ophthalmol Vis Sci. 2012;53:5287–91.
Hutchinson M. Optical coherence tomography should be part of the routine monitoring of patients with multiple sclerosis: commentary. Mult Scler. 2014;20:1302–3.
Author information
Authors and Affiliations
Corresponding author
Editor information
Editors and Affiliations
Electronic Supplementary Material
Below is the link to the electronic supplementary material.
Video showing correct placement of the OCT measurement beam to the center of the pupil and artifacts related to off-center placement (Reproduced with permission from Balk et al. [14].) (MP4 148502 kb)
Rights and permissions
Copyright information
© 2016 Springer International Publishing Switzerland
About this chapter
Cite this chapter
Petzold, A. (2016). Optical Coherence Tomography (OCT). In: Petzold, A. (eds) Optical Coherence Tomography in Multiple Sclerosis. Springer, Cham. https://doi.org/10.1007/978-3-319-20970-8_3
Download citation
DOI: https://doi.org/10.1007/978-3-319-20970-8_3
Publisher Name: Springer, Cham
Print ISBN: 978-3-319-20969-2
Online ISBN: 978-3-319-20970-8
eBook Packages: MedicineMedicine (R0)