
Abstract
This chapter contains questions on X-rays, radiography, fluoroscopy, CT, PET/CT, MRI, and ultrasound. The questions and detailed answers are developed with the goal of helping the reader to assess their knowledge on the fundamentals and clinical applications of imaging physics. The references are intended to provide the reader with the resources to improve their knowledge in this topic.
Access provided by Autonomous University of Puebla. Download chapter PDF
Keywords
- Computed tomography (CT)
- Positron-emission tomography (PET)
- Magnetic resonance imaging (MRI)
- Imaging physics
- Radiography
- Fluoroscopy
-
1.
Which of the following tube-detector relationships attribute to ring artifacts on the computed tomographic image?
-
A.
Rotate-translate
-
B.
Translate-rotate
-
C.
Rotate-rotate
-
D.
All of the above
Answer: C
Ring artifact is caused by a miscalibrated or defective detector element, which results in rings centered on the center of rotation. This can often be fixed by recalibrating the detector. A scanner with solid-state detectors, where all the detectors are separate entities, is in principle more susceptible to ring artifacts [1].
-
A.
-
2.
How will you define “pitch” for a helical CT?
-
A.
Table movement in 360°/beam width
-
B.
Projections at neighboring scan-axis positions
-
C.
Reconstructed slice thickness
-
D.
A plane through the body perpendicular to the scan-axis
Answer: A
Pitch (P) is a term used in helical CT. It has two terminologies depending on the scanner type (single or multislice). Choice of pitch affects both image quality and patient dose.
Single-slice CT:
The term detector pitch is used and is defined as the table distance traveled in one 360° gantry rotation divided by beam collimation.
Multislice CT:
Beam pitch is defined as the table distance traveled in one 360° gantry rotation divided by the total thickness of all simultaneously acquired slices [2].
-
A.
-
3.
If only the patient size changes, provided that we keep all other scan parameters the same, what happens to the radiation dose delivered?
-
A.
Increasing patient size causes decreased dose.
-
B.
Increasing patient size causes an increased dose.
-
C.
No relation between patient size and dose.
-
D.
Increasing patient size does not change the dose.
Answer: B
CTDI (measured in mGy) is a standardized measure of the radiation dose output of a CT scanner, which allows the user to compare the radiation output of different CT scanners.
CTDI100 (mGy) is a linear measure of dose distribution over a pencil ionization chamber and hence does not take into consideration the topographical variation of a human body and is therefore not in clinical use.
CTDIw (mGy) is closer to the human dose profile as compared with the CTDI100:
2/3 CTDI100 (periphery) + 1/3 CTDI100 (center)
CTDIvol (mGy) is obtained by dividing CTDIw by pitch factor.
Another commonly used index is the dose-length product (DLP), which factors in the length of the scan to show the overall dose output.
DLP (mGy*cm) = CTDIvol × scan length.
CTDI is a measure of patient dose. The concerning X-ray tube’s output must be an increased actual dose to any given patient, which is directly dependent on the size and shape of the patient. To achieve similar image quality, the scanner output (CTDIvol) should be increased by about a factor of two as patient size changes from a typical adult abdomen (lateral dimension, 35–40 cm) to an obese adult abdomen (lateral width, 45–50 cm) [3, 4].
-
A.
-
4.
What does the beam hardening in X-ray imaging means:
-
A.
Decrease in a photon’s energy as it is scattered by a dense material
-
B.
Increased average X-ray energy as a beam passes through a dense material
-
C.
Decreased average X-ray energy as a beam passes through a dense material
-
D.
Increase in a photon’s energy as it is scattered by a dense material
Answer: B
Beam hardening is the occurrence that happens when an X-ray beam composed of polychromatic energies passes through an object, resulting in selective attenuation of lower energy photons. The effect is similar to a high-pass filter, in that only higher energy photons are left to contribute to the beam and thus the mean energy of the beam is increased [5].
-
A.
-
5.
While performing an ultrasound scan, the technician notices that the echoes at a depth of 5–7 cm appear relatively weak. What parameter needs tweaking to increase the brightness of the image?
-
A.
Frequency
-
B.
Focusing
-
C.
TGC
-
D.
Beam intensity
Answer: C
The time-gain compensation (TGC) is the control that can be used to selectively amplify the echoes from any specific depth. This adjustment is accomplished by TGC controls that permit the user to selectively amplify the signals from posterior structures or to suppress the signals from anterior tissues, thereby compensating for tissue attenuation [6].
-
A.
-
6.
Which of the following increases the signal-to-noise ratio of a CT image?
-
A.
Decreased aperture size
-
B.
Decreased milliampere seconds (mAs)
-
C.
Increased aperture size
-
D.
Increased filtration
Answer: C
SNR is a generic term that, in radiology, is a measure of true signal to noise.
In CT, the signal-to-noise ratio is determined by:
mAs: greater mAs increase SNR.
The mAs or the dose of a CT scan has a direct relationship with the number of photons utilized in the examination.
2× mAs = 40% increased SNR.
Slice thickness: thicker slices increase SNR.
Scan slice thickness is often very thin at 1 mm. However, viewing is thicker, at 4 mm, averaging 4.
1 mm Slices into one thick 4 mm will increase the signal by 4×, but the noise will increase √4 = 2×.
Patient size: larger patients reduce SNR [7].
-
A.
-
7.
What factor does the subject contrast for a CT image depends on?
-
A.
kV
-
B.
Focal spot
-
C.
mA
-
D.
Collimation
Answer: A
Subject contrast is the ratio of transmitted radiation intensities and is, thus, dependent on the absorption differences in the subject, photon energy, and scattered radiation. Low-kilovoltage photons will generally result in a radiograph with high contrast. mA will impact the signal-to-noise ratio. The focal spot will impact image sharpness with a larger penumbra associated with a larger focal spot [3].
-
A.
-
8.
What image quality parameter is being evaluated in this image?

-
A.
Spatial resolution
-
B.
Noise
-
C.
Contrast
-
D.
Uniformity
Answer: C
The test object shown is composed of discs of varying densities and is used to evaluate low-contrast detectability. Contrast refers to the ability to distinguish subtle differences in material composition [8].
-
A.
-
9.
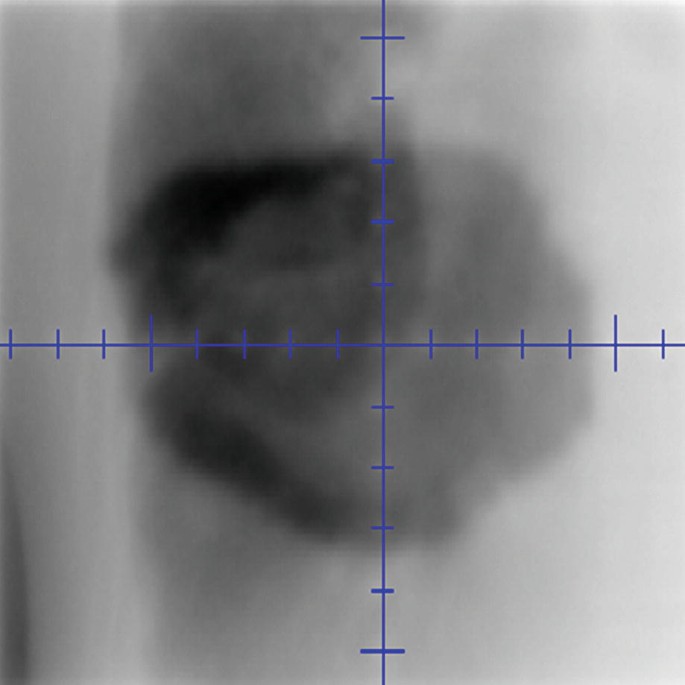
The shown radiographic image’s quality is affected by:

-
(i)
Quantum mottle
-
(ii)
Unsharpness
-
(iii)
Resolution
-
(iv)
Contrast
-
A.
All the above
-
B.
None of the above
-
C.
i, ii, and iii
-
D.
i, ii, and iv
-
A.
Answer: C
Quantum mottle is the statistical fluctuation of the number of photons absorbed by the intensifying screens to form the light image on the film. Quantum mottle artifact is when the X-rays are produced but are not produced uniformly. Quantum mottle noise is a result of an inefficient number of photons reaching the imaging plate due to an error in the preset exposure factors (mAs and kVp). Quantum mottle will cause fluctuation in image densities, resulting in images with a grainy appearance. This in turn creates unsharpness and poor resolution in the obtained image.
-
(i)
-
10.
What is the CT Hounsfield unit of water?
-
A.
500
-
B.
−1000
-
C.
0
-
D.
−700
Answer: C
The tolerance for the CT Hounsfield unit of water is 0 ± 5 HU. A Hounsfield unit value of −1000 is typically representative of air, −700 is typically representative of the lung, and 500 is typically representative of bone [9].
-
A.
-
11.
A modulation transfer function equal to 1.0 at a particular spatial frequency (f) means:
-
A.
An electronic circuit utilized with automatic brightness control is set to perfect linearity.
-
B.
Energy transferred to tissue is equal to that of the incident radiation.
-
C.
The diagnostic image perfectly reproduces contrast variations in the object radiographed at that spatial frequency.
-
D.
High-voltage ripple transmitted from mains fluctuations is 1%.
Answer: C
The modulation transfer function (MTF) determines how much contrast in the original object is maintained by the detector. In other words, it characterizes how faithfully the spatial frequency content of the object gets transferred to the image. The modulation transfer function of an image intensifier is a measure of the output amplitude of dark and light lines on the display for a given level of input from lines presented to the photocathode at different resolutions. It is usually given as a percentage at a given frequency (spacing) of light and dark lines [10].
-
A.
-
12.
Quality of digitally reconstructed radiographs depends upon:
-
(i)
Pitch
-
(ii)
Slice thickness
-
(iii)
FOV
-
(iv)
Mode
-
A.
All the above
-
B.
None of the above
-
C.
i, ii, and iii
-
D.
i, ii, and iv
-
A.
Answer: C
Digitally reconstructed radiographs (DRRs) are computed transmission images of the patient’s anatomy in the beam’s-eye view calculated from computed tomography (CT).
Dataset onto a planar view: They are generated from the same CT datasets used for treatment planning and provide a reference image for the verification of patient position during radiotherapy treatment. DRRs are generated from CT images; the image quality may be affected by the CT scanning mode (axial or helical), parameters such as scanning pitch and reconstruction pitch, as well as the number of virtual X-ray lines.
Projected from the virtual source in the calculation of the DRR: Helical scanning has several advantages over axial scanning such as fast volumetric data acquisition lower dose to the patient and reduced beam-hardening streak artifacts. However, unlike axial scanning, longitudinal slice positions in helical scanning are reconstructed using a variety of interpolation schemes, which can lead to loss of spatial resolution in the longitudinal direction. Aliasing in helical scanning at pitches greater than 1 also influences the spatial resolution of multiplanar images. Therefore, the quality of DRRs generated from helical scanning data can potentially be influenced by the helical pitch, slice thickness, and scanned field of view (FOV) [11].
-
(i)
-
13.
What are the disadvantages of double-exposure port film?
-
(i)
Additional anatomical landmarks and details
-
(ii)
Probability of stochastic effect
-
(iii)
Imaging dose cannot be accounted with treatment dose
-
(iv)
Image blurring
-
A.
i and ii
-
B.
ii and iii
-
C.
All of the above
-
D.
None of the above
-
A.
Answer: B
Localization radiograph is produced by a sequence of two exposures, first to a shaped treatment field and then to a larger rectangular field. The resulting image serves to locate the treatment field borders with respect to the patient’s anatomy.
Portal images are acquired either by single-exposure technique or by double-exposure technique. In a single-exposure technique, the treatment beam is used to image the region to be treated when adequate landmarks are available for verification within this region. The dose delivered during this single-exposure portal imaging is usually adjusted from the treatment dose, and this does not deliver the dose to normal tissues. When adequate landmarks are not available within the treatment region, a double-exposure technique is used. In this double-exposure technique, a field at least 5 cm larger than the area to be treated is also imaged in addition to the region to be treated. This results in delivering dose outside the tumor volume and thus increases the probability of stochastic effect. The risk of cancer induction is additive, and the concomitant dose from the double-exposure portal images adds to the dose received by the patient due to leakage and scatter radiation [12].
-
(i)
-
14.
Identify and order differently weighted MRI images:

-
A.
T1, T2, FLAIR
-
B.
T2, T1, FLAIR
-
C.
FLAIR, T2, T1
-
D.
T1, FLAIR, T2
Answer: A
CSF appears dark in a T1-weighted and FLAIR image and bright in a T2-weighted image. White matter appears light in T1 and dark gray in T2 and FLAIR. Fat appears bright in T1 and light in T2 and FLAIR images [13].
-
A.
-
15.
Which of the following is used for attenuation correction on PET/CT scanners?
-
A.
PET emission scan only
-
B.
The CT portion of the exam and associated attenuation values
-
C.
K-space values
-
D.
A transmission scan is performed after the CT
Answer: B
PET image data scanned with PET/CT scanners is attenuation corrected using data from computed tomography (CT). Although CT-based attenuation correction is generally reliable, patient movement and remains of CT contrast media may cause quantitative errors and image artifacts. Respiratory movement causes differences in the CT-based attenuation map and the actual attenuation during PET scan, which may cause bias.
It is important to note that attenuation-corrected dataset can introduce several artifacts like contrast-based artifacts, implanted device attenuation artifacts, and diaphragmatic respiratory artifacts. Hence, it is imperative to become familiar with the common and atypical appearances of the most common artifacts and be diligent about inspecting the non-AC PET images when an AC artifact is suspected [14, 15].
-
A.
-
16.
Compared with a 1.5-T MRI scanner, what is the primary advantage of a 3-T MRI scanner?
-
A.
Lower price
-
B.
Higher signal-to-noise ratio (SNR)
-
C.
Lower energy deposition in tissues
-
D.
Increased safety for patients with medical devices or implants
Answer: B
The amount of energy deposited in tissues by radiofrequency pulses (specific absorption rate [SAR]) is proportional to the square of magnetic field strength and, thus, higher at high B fields [16].
-
A.
-
17.
In stereotactic treatment planning, the MRI data are typically fused with CT images. What is an advantage of using MRI compared with CT?
-
A.
Short acquisition time
-
B.
Higher spatial resolution
-
C.
Superior soft-tissue contrast
-
D.
Accurate electron density
Answer: C
CT is commonly used in radiation therapy planning because it provides superior spatial accuracy and electron density information necessary for heterogeneity corrections. MRI provides superior soft-tissue contrast and visualization of tumor invasion of surrounding soft tissues. A disadvantage of MRI is its inferior spatial accuracy and lack of electron density information. Another MRI disadvantage is the inability to differentiate between bone and air. Also, long scan times and absence of immobilization make MRI susceptible to patient motion artifacts [17].
-
A.
-
18.
What CT image set is best suited for treatment planning dose calculations for a lung lesion to be treated with radiotherapy?
-
A.
Minimum intensity projection CT
-
B.
Maximum intensity projection CT
-
C.
Free-breathing CT
-
D.
Average intensity projection CT
Answer: D
An average intensity projection (AIP) dataset derived from a 4D CT scan has been shown to be most useful for both treatment planning dose calculations and verification of tumor location via image-guided radiation therapy. Free-breathing datasets are prone to significant image artifacts, and MIP and MinIP datasets may not accurately represent the target volume, especially when the target is close to more dense tissues [18].
-
A.
-
19.
What registration technique involves a transformation to preserve the distance between all points in the image and can include translation and rotations in all directions? Registration QA:
-
A.
Affine
-
B.
Rigid
-
C.
Deformable
-
D.
Fusion
Answer: B
Rigid registration involves transformation to preserve the distance between all points in the image and can include translation and rotations in all directions. Image fusion is a technique where the mapped data from the moving dataset are combined with the stationary dataset. Deformable registration transformation can also be spatially variant where the number of degrees of freedom can be as large as three times the number of voxels in the source dataset. It warps a moving image via a deformable field to align with a target image and defines the motion of each voxel from the moving image to the target image. Affine registration includes transformation from rigid registration and adds additional transformation of scaling, shearing, and plane reflection. The distance between all points is not maintained as in rigid registration, but the parallel lines remain parallel after transformation [19].
-
A.
-
20.
What is the main advantage of MV-CBCT over KV-CBCT?
-
A.
Low imaging dose for the patient
-
B.
Fewer artifacts due to metal implants
-
C.
Better visualization of soft tissue
-
D.
Improved image contrast
Answer: B
Due to the dominant interaction of the Compton effect, MV cone-beam CT is less susceptible to metallic artifacts and produces images with less contrast because it depends more on electron density than atomic number. The decrease, in contrast, impacts the ability to visualize soft tissue. CT numbers created with MV cone-beam CT also have a direct correlation with electron density with the therapeutic beam, and no extrapolation is needed to calculate the imaging dose [20].
-
A.
-
21.
What is the most appropriate imaging modality to guide the placement of low-dose-rate brachytherapy seeds in the prostate?
-
A.
MRI
-
B.
CT
-
C.
Ultrasound
-
D.
Fluoroscopy
Answer: C
Transrectal ultrasound is the preferred imaging modality when performing permanent prostate brachytherapy. Fluoroscopy is oftentimes used to determine needle and/or distal seed extent relative to the bladder, which is usually filled with contrast but is not used for the 3D positioning of seeds [21].
-
A.
-
22.
What is an advantage of filtered back projection compared with iterative reconstruction methods?
-
A.
Filtered back projection is less sensitive to missing information.
-
B.
Filtered back projection is faster.
-
C.
Filtered back projection results in a lower dose to the patient for the same signal-to-noise ratio.
-
D.
Filtered back projection can be used with all 3D modalities.
Answer: B
Filtered back projection was the primary reconstruction method for CT imaging, including that used by CT simulators for therapy planning. Iterative methods are more complicated and correspondingly more computationally intensive; however, as methods improved and computers became faster, they became practical for the clinic. For the same patient dose, iterative methods offer better signal-to-noise ratios than filtered back projection. Additionally, iterative methods are less sensitive to missing information and, therefore, less prone to metal artifacts [22].
-
A.
-
23.
Which image registration method tries to align voxels whose values have common probabilities of being present in their respective image sets?
-
A.
Mutual information
-
B.
Sum of squared differences
-
C.
Correlation coefficient
-
D.
Mean squared difference
Answer: A
Voxel-based registration methods include the sum of the squared difference (SOSD), mean squared difference (MSD), correlation coefficient (CC), and mutual information. SOSD and MSD assume an equivalent relationship between voxel intensities in the two images and only really work when both image sets are in the same modality. The normalized CC metric measures the similarity in the image signal (so should be used with images that have similar voxel intensities for similar organs) and maximizes the intensity product with the assumption that there is a linear relationship between the intensity values in each image; it can handle differences in image contrast better than the first two metrics, but requires the voxel intensities to be correlated. Only mutual information, which assumes a statistical relationship between the voxel intensities with no dependence on absolute intensity values, is appropriate with two very different modalities like CT and MRI [19].
-
A.
-
24.
Resolution of the imaging system is a characteristic that is directly related to:
-
(i)
Image unsharpness
-
(ii)
Visibility of anatomical detail
-
(iii)
Image noise
-
(iv)
Image blurring
-
A.
i
-
B.
i, ii, and iv
-
C.
iii and iv
-
D.
None of the above
-
A.
Answer: B
Image resolution is the detail an image holds. Higher resolution means more image detail. Resolution is the ability of an imaging system to reproduce a sharp edge that is present in the object. The key factors that influence the sharpness of an image relate to the size of the source of X-rays, the physical characteristics of the X-ray detector system, and the presence of any motion blur because of the finite duration of all radiographic exposures. Blurring refers to the distortion of the definition of objects in an image, resulting in poor spatial resolution. Blurring produces image unsharpness, decreases the visibility of anatomical detail, and reduces resolution if the resolution is being measured [6].
-
(i)


References
Martz HE, Logan CM, Schneberk DJ, Shull PJ. X-ray imaging fundamentals, industrial techniques and applications 2017.
Allisy-Roberts PJ, Williams J. Farr’s physics for medical imaging. 2nd ed; 2008.
Bushberg JT, Seibert JA, Leidholdt EM Jr, Boone JM. The essential physics of medical imaging. Lippincott Williams & Wilkins; 2011.
Wilting JE, et al. A rational approach to dose reduction in CT: individualized scan protocols. Eur Radiol. 2001;11(12):2627–32.
Andreas Maier, Stefan Steidl, Vincent Christlein, Joachim Hornegger. Medical imaging systems an introductory guide 2018.
Sprawls P. The physical principles of medical imaging. 2nd ed; 1995.
Seeram E. Computed tomography: physical principles, clinical applications, and quality control. 4th ed; 2015.
Fontenot JD, Hassaan A, et al. AAPM medical physics practice guideline 2.A: commissioning and quality assurance of X-ray-based image-guided radiotherapy systems. J Appl Clin Med Phys. 2014;15(1):4528.
Report No. 083–Quality assurance for computed-tomography simulators and the computed-tomography-simulation process: report of the AAPM radiation therapy committee task group no. 66. Med Phys. 2003;30:2762–92.
Samei E, et al. Comparison of edge analysis techniques for the determination of the MTF of digital radiographic systems. Phys Med Biol. 2005;50(15):3613–25.
Michael Goitein. Radiation oncology: a physicist’s—eye view. 2008.
Ravindran P. Dose optimisation during imaging in radiotherapy. Biomed Imaging Interv J. 2007;3(2):e23.
Carrio I, Ros P, editors. PET/MRI–methodology and clinical applications. Springer; 2014.
Blodgett TM, et al. PET/CT artifacts. Clin Imaging. 2011;35(1):49–63.
Zhou J, et al. Imaging techniques in stereotactic radiosurgery. In: Chin L, Regine W, editors. Principles and practice of stereotactic radiosurgery. New York: Springer; 2015. https://doi.org/10.1007/978-1-4614-8363-2_2.
Katsuragawa, S., Doi, K. Hendee’s physics of medical imaging, fifth edition, by Ehsan Samei and Donald JP. Radiol Phys Technol. 2019;12: 438–439.
Tian Y, Wang Z, Ge H, Zhang T, Cai J, Kelsey C, Yoo D, Yin FF. Dosimetric comparison of treatment plans based on free breathing, maximum, and average intensity projection CTs for lung cancer SBRT. Med Phys. 2012;39(5):2754–60. https://doi.org/10.1118/1.4705353.
Report No. 132—Use of image registration and fusion algorithms and techniques in radiotherapy: report of the AAPM radiation therapy committee task group no. 132. 2017.
Khan FM. Khan’s the physics of radiation therapy. Fifth ed. Lippincott Williams & Wilkins; 2014.
Davis BJ, et al. American Brachytherapy Society. American Brachytherapy Society consensus guidelines for transrectal ultrasound-guided permanent prostate brachytherapy. Brachytherapy. 2012;11(1):6–19.
Klink T, Obmann V, Heverhagen J, Stork A, Adam G, Begemann P. Reducing CT radiation dose with iterative reconstruction algorithms: the influence of scan and reconstruction parameters on image quality and CTDIvol. Eur J Radiol. 2014;83(9):1645–54. https://doi.org/10.1016/j.ejrad.2014.05.033.
Author information
Authors and Affiliations
Corresponding author
Editor information
Editors and Affiliations
Rights and permissions
Copyright information
© 2022 The Author(s), under exclusive license to Springer Nature Switzerland AG
About this chapter

Cite this chapter
Sakthivel, V., Boopathy, R. (2022). Imaging. In: Heard, M., Boopathy, R., Thomas, Jr., C.R. (eds) Absolute Therapeutic Medical Physics Review. Springer, Cham. https://doi.org/10.1007/978-3-031-14671-8_12
Download citation
DOI: https://doi.org/10.1007/978-3-031-14671-8_12
Published:
Publisher Name: Springer, Cham
Print ISBN: 978-3-031-14670-1
Online ISBN: 978-3-031-14671-8
eBook Packages: Physics and AstronomyPhysics and Astronomy (R0)