
Abstract
The present paper shows a methodological approach for the realization of studies on designer’s emotional parameters during the idea generation phase. This approach is based on a comparative analysis of the different experiences carried out for measuring emotional states using different methods and tools. The aim of this methodological approach is to know the reactions of designers when solving a design problem or when using a specific method, and their relation with the results achieved, both at functional, creative or emotional level. This fact will allow a great advance in the field of design method development, since a better method-designer adaptation can be achieved, and consequently a better design results. The methodological approach has been tested thanks to the collaboration of the Vitale design study’s staff, from Castellón de la Plana (Spain). The present paper also shows this experience performance, as well as the results registered during it
Access provided by Autonomous University of Puebla. Download conference paper PDF
Keywords
1 Introduction
Design for or through emotions is an attractive topic within the field of product design [9]. The key point is how to locate the elements that generate emotions in the product interaction experience, since these elements will allow an emotional link to be generated between the user (or consumer) and the product (or brand), and they also help to guarantee users’ satisfaction, as defended in the concept “Feel marketing” [32]. Different design methods and techniques are employed by designers in order to find these affective components, which are personal but classifiable, as well as to increase the knowledge about the product experience. In this respect, we can look at Kansei engineering, which allows the emotional needs to be located in order to achieve a mathematical model with the aim of establishing the relations between product characteristics and users’ preferences [15, 35]. Another method commonly used in the emotional design, mainly to quantify product perception in affective terms, is the Semantic Differential [26]. Customer surveys or questionnaires are also a basic technique that we must consider at this point. They are useful to gather information about affective responses in quantitative terms, as can be seen in Desmet [8], who synthesized 25 positive emotions related to human-product interaction through an exhaustive procedure, the core of which was a questionnaire, or Mauss and Robinson [18], whose research defends that different types of stimuli that cause an emotion are associated with discrete patterns of response. There are also many qualitative techniques that make it possible to “capture” the emotions generated by users when they experiment with a product: structured interviews, focus groups or direct observation, among others [4, 5, 19, 36]. Some authors, however, chose to combine the techniques that best fit their objectives when they design an experiment. So, protocols are created that are useful to other researchers to broaden their studies, such as the case of the usability tests employed in the field of emotions and behavior [27].
Yet, besides product-generated emotions, the designer’s emotions should also be focused on, since they may affect the design process and, consequently, the design results. Several studies defend the idea that the emotional state of the individual will affect the results of the design activity, such as the Flow Theory in Nakamura and Csikszentmihalyi [23], where it is defended that there is an optimal mental state that is experienced when the individual perceives the opportunities for action as being in balance with his or her perceived skills. Similar to this line of work is the research carried out by Akinola and Mendes [1], who state that negative emotions promote artistic creativity, or the research by Hutton and Sundar [11], which, in contrast to the work of Akinola and Mendes, defends the notion that happy people are more creative than angry people. Thus, there is an interest in knowing what emotions they feel when designing and how these emotional states are transmitted to users and costumers through their creations. It is at this point where we find the study by Rodríguez [30], who works with design professionals and enterprises in order to discern the strategies that allow the generation of the “magical” surprise effect on customers.
In this search for emotions [24], it becomes essential to be able to measure emotional parameters, where emotional parameters can be understood as defined emotional responses that can be identified and measured. These can be measured with different methods and devices, some of which look into them at a deeper level than the simple question-to-individual strategy, thus making it possible to avoid the subjective nature of the data gained in this way. Moridis and Economides [20] point to some common techniques, including facial expressions, speech recognition, physiological data, and questionnaires, among others. Nonetheless, cerebral response to external stimuli produces measurable electrical changes, which supposedly allow the researcher to measure what the subject perceives and his or her response to these perceptions in a more accurate way, since the signals are measured directly from the brain and in the same instant in which the emotion is generated. For this purpose, electroencephalographic (EEG) signals must be recorded with sensors (there are both invasive and noninvasive devices). There is an extensive body of literature related to the brain-computer interaction behind this process [13, 21, 31], which points to the use of this kind of devices to capture and decode these signals from different parts of the brain in order to be able to analyze them.
Many recent works have dealt with the recognition and treatment of customer emotions when faced with particular products or stimuli, ranging from chromatic aspects [22] to durable products [25], or their technological aspects [36]. Nonetheless, few works have measured, not customer emotions, but the emotions and mental processes that are generated in the designers’ minds when they are in their creative phase [33]. The possibility of being able to know the designer’s reactions (emotional response) when tackling a design problem or using a design method, and the relation between these reactions and the functional, creative, and emotional results achieved will represent a great step forward in the field of design methods, since the better the method-designer relationship is, the better the design results will be.
For this purpose, the present paper shows, first of all, a comparative analysis of different studies carried out to measure the emotional parameters using different methods and devices. It also analyzes which emotional parameters are usually studied, the sample analyzed and the time of each experiment. A methodological approach is then presented in order to conduct studies on measuring the emotional parameters of designers during the design process. This methodology aims to act as a standard in the measurement of the emotional parameters of designers, thereby helping researchers, when preparing their experiments, with the aim of improving the performance of their measurements, and avoiding the problems that could cause incorrect data collection. The methodological approach has been tested, thanks to the collaboration of the staff working at the Vitale Design Studio. The paper also describes how this experiment was conducted, as well as the results registered and their formats, just to exemplify how data is collected and presented. The data analysis of this test is not used to defend any hypothesis about the designer’s emotions.
2 Background
2.1 Measuring Emotion Through Facial Recognition or Eye-Tracking
Several works have been carried out in which facial recognition or eye-tracking has been used to identify human emotions (see Table 20.1). In some cases, they have been combined with other kinds of sensors to measure emotions, such as the studies by Arroyo et al. [2] and Cooper et al. [6], who also use sensors on the chair, the mouse and the wrist, or the work of Marti et al. [17], who use biosensors. The facial recognition or eye-tracking measuring system has been used in most of the studies conducted on students (both secondary school and university). In these studies focused on students, confidence, excitement or enthusiasm and frustration were chosen as emotional parameters to measure interest or curiosity. There are also few works that concentrate on designers. A significant case is the work of Sun et al. [33], which is not focused on emotions themselves, but on the designer’s fixation during the sketching process in the conceptual phase.
Regarding the conditions of the studies, they vary widely in terms of sample and time. That is, the sample size ranges from 29 to 172 subjects, and the time from 30 min to 5 days of data recording. Nonetheless, the study regarding designers’ activity comprises 41 subjects and 30 min of problem-solving.
2.2 Measuring Emotion Through Questionnaires, Interviews or Semantic Differential
Among the studies on measures of emotion, there are some that base their methodological model on semantic differential tools. This technique frequently uses a questionnaire with previously selected adjectives as emotional items, commonly taken as bipolar pairs. The selection of these adjectives must be done carefully, since it can condition the results and cause bias. For this purpose, there are works like those by Na and Suk [22], who introduce a previous phase in their studies in order to compile a set of words related to emotional parameters on which the study will be based. Following this line, Desmet [8], summarizes the positive emotions of the human-product interaction in 25 adjectives, which have been used by other authors in subsequent research work [25]. Nonetheless, the “emotional words” based questionnaires are normally presented in combination with other stimuli, like images [8, 25], mock-ups [22], or sounds [36].
There are other qualitative techniques for determining emotional reactions, such as interviews or direct observation. For example, Jordan [14], used semi-structured interviews in his studies on the pleasure of using a product. Yoon et al. [36] also combined these qualitative techniques with the use of questionnaires in their research.
The research reviewed (Table 20.2), presents many differences in parameters, samples and time. The emotional parameters vary from 5 to 150, the sample size from 18 to 221, and the time from 15 min to 1 h.
2.3 Measuring Emotion Through Neuronal Response
The most frequent studies in the field of direct measurement of emotional parameters through neurosensors are those referring to psychological works in which a predefined emotion is triggered and neuronal response is measured (see Table 20.3). That is, images, sounds or videos created to cause a predetermined emotion are shown to the subjects, and the neuronal electrical response that is caused is registered [3, 28, 29]. This is the reason why the role of the subjects is not really relevant in this kind of studies. The sample size ranges from 6 to 25 subjects. Time dedicated for each “measurement” is short because it is conditioned to the exposure to the stimulus considered in each case: seconds for sounds or images, minutes for videos.
2.4 Considerations on Methodology Development
From the background analysis, the aim is to discern the best way to identify and measure the emotional parameters of designers. It is also necessary to determine which emotional parameters are recommended for measurement. Moreover, an adequate sample size and time must also be set.
Of the three options analyzed—facial recognition, questionnaires, and neuronal response—the first is not recommended, since the face must be oriented toward the same point all the time so that the cameras can detect or record the facial expressions or the eye movements. It is, therefore, not suitable for measuring design activities, in which the subject must move, and so the cameras must cover the full sphere of possible positions of the face (41,253 square degrees). Moreover, the face could be hidden from time to time by the designer’s body movements or hands. Questionnaires and interviews present the subjective memory of the subject after the action, while neuronal response can be measured at the same time as the action happens, and is presumably objective. Hence, a device for measuring neuronal response seems to be a better option for our purpose than the other analyzed options.
Nonetheless, most of the related studies analyzed in the previous point consist of inducing an emotion with a stimulus that is known to cause this emotion in order to measure and identify the neuronal response, while the approach proposed in this paper aims to act in the opposite direction. That is, the methodology will be for performing experiments in which the emotion caused by an action is unknown, so we need to measure the neuronal response in order to identify the emotion. This is similar to the method presented by Inventado et al. [12], in which they measure students’ emotions when using a computer software application.
Furthermore, from the background analysis, it can be seen that most of the work reported to date is centered on students’ emotional parameters or just “subjects”, with no information about their profession, due to the fact that those research studies are not related to any specific task. Only the work by Sun et al. [33], is related to the work of designers, and it was more focused on identifying the designer’s fixation during the sketching process than on their emotional parameters. Thus, a methodological approach is needed in order to be able to perform this kind of studies—measuring the emotional parameters of designers during the design process.
3 Methodological Approach
The measuring tool selected for testing the proposed methodological approach is the Emotiv EPOC neuroheadset (Fig. 20.1), since it has previously been validated [7, 16], and used successfully in several works [12, 28, 29]. The emotional parameters that it can measure are excitement (versus calm), disinterest (versus engagement), and the degree of meditation (understood as a state of deep thought), which are measured in the literature review presented above. The data-collecting electrodes are located and labeled according to the international 10–20 system depicted in Ramirez and Vamvakousis [29]. Another reason for selecting this device is that the Emotiv EPOC neuroheadset will allow the designer freedom of movement and it will record the emotional parameters in real time.

Emotiv EPOC neuroheadset
A review of the research to date shows that sample size may vary widely (from 6 to 221). As the aim is for the results of the experiments to be analyzed statistically, the authors suggest a minimal sample size of 12 and an optimal one of 32 samples.
With respect to the expected time to solve each design problem, all similar experiments reviewed allow for a range of 20 to 45 min per exercise. In addition, a break between problems is provided, in which the emotional response of the subjects is also recorded so it can be used as a control measurement. This point is easily achievable with the selected measuring tool, since it does not restrict the designers’ movement. For an initial pilot test, the authors decided to set 25 min for each problem-solving phase and 10 min for resting between problems.
Moreover, a test in the last step of the methodology is proposed to discern whether the designers’ perceived emotions agree with those measured in real-time.
Hence, the stages of the experiments will be:
-
1.
Informal chat with some non-stimulant drink and/or food (in order to try to achieve a similar initial mood for all participants)
-
2.
Explanation and instruction (if required)
-
3.
Solving of case 1 (25 min)
-
4.
Rest (10 min)—data recording is not stopped
-
5.
Solving of case 2 (25 min)
-
6.
Questionnaire
Steps 4 and 5 can be repeated if there is more than one variable under consideration in the raised hypothesis.
4 Initial Results
4.1 Development of the Experiment
The proposed method was tested on two professional designers from Vitale, a design studio specialized in furniture, lamps, and corporative design. The testing was performed only to prove that the proposed methodology is useful, to show how the results will be presented, and to find and solve the possible problems that can appear when using the methodology experimentally. The volunteer designers were two young adult males with more than 10 years’ experience in the field of design. As it was a test of the method and the selected tools, no hypothesis was analyzed. Thus, steps 4 and 5, were not considered and just one problem was raised. In this case, the designers had to generate ideas for the design of a small recycling container placed in urban spaces for collecting specific kinds of waste such as light bulbs, batteries, ball pens, mobile phones, battery chargers, ink cartridges, and DVDs. The main objective of the design was to make it fun to use. Following the steps of the method, the experiment was carried out as follows:
-
1.
The Emotiv EPOC neuroheadsets were introduced to the designers, and they were shown a Powerpoint presentation, consisting of a reference video fostering good behavior in public spaces (https://www.youtube.com/watch?v=tcrhp-IWK2w), an image related to the problem (Fig. 20.2), and the problem statement.
Fig. 20.2 
The image related to the problem that was shown to the designers in step 1
-
2.
The designers were equipped with the Emotiv EPOC neuroheadsets, and they were given 25 min to solve the problem individually. They were provided with A3 sheets of paper and markers of different colors. They were free to move how and when they wanted.
-
3.
During the design, an external observer recorded every time the designer changed from one stage of the design process to another, the stages being: understanding the problem and searching for information (PU), thinking about ideas (TI), selecting the final solution from among the ideas (SS), and representing the solution (RS).
-
4.
The results were recorded both graphically and numerically. An extract of the numerical data captured is shown in Table 20.4. The numerical data vary from 0 to 1 and a decrease in the data means that the emotion had become less intense and, on the contrary, if the number measured increases, then the emotion is more intense. A brief analysis of these data is shown in “4.2. Data analysis”.
Table 20.4 Extract of the numerical data captured (each measure—row—is taken approximately every 0.5 s) Steps 3 and 4 were omitted, as explained previously.
-
5.
A test was answered by the designers in order to evaluate the experience and their feelings with the aim of comparing their answers with the measurements of the neuroheadsets. First of all, the test asked them about how motivating they felt the design problem was, by assigning a score of between 1 and 10. They then had to value whether their emotional state had changed or not during the four design tasks: problem understanding, searching for ideas, selection of ideas, and final representations. If their emotional state changed, they were asked to assess whether their enthusiasm increased or decreased, how intensely it changed, and finally if this change was a one-off occurrence or remained stable throughout the task. The last question concerned the intensity of concentration required for each design task, and they were asked to score it from 1 to 10 (Fig. 20.3). The answers of the two designers are also marked in Fig. 20.3.
Fig. 20.3 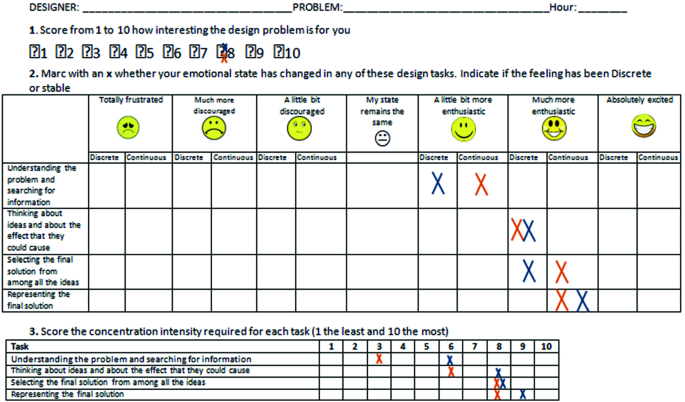
Questionnaire given to the designers in step 5


4.2 Data Analysis
Despite the fact that the aim of the study is to propose a methodology and no hypothesis was proposed about the data analysis, it can be commented on in order to better exemplify the case. Nonetheless, the authors are fully aware that the sample size is too small to be able to show solid conclusions about this data analysis.
The data collected can be shown as a graph, in order to analyze peak points or general trends over time. Figure 20.4 shows an extract from the parameter excitement graph of one of the designers who were analyzed. Nonetheless, the huge number of points that the program provides suggests it might be better to use another kind of analysis, like a box and whiskers plot. Figures 20.5 and 20.6 show the plots of excitement and meditation for both designers in each of the design phases previously defined.

Extract of the graph showing the evolution of the parameter “excitement” of one of the designers analyzed

Box and whiskers plot of excitement measured for problem understanding (PU), thinking ideas (TI), solution selection (SS), and representing the solution (RS)

Box and whiskers plot of the parameter “meditation” measured for problem understanding (PU), thinking ideas (TI), solution selection (SS), and representing the solution (RS)
Figure 20.5 shows that the two designers have a higher level of excitement after the initial stage (problem understanding) and it is remarkable how the second designer has a significant peak of excitement at the end. If we compare the acquired data with the designers’ perceptions, as they answered in the final questionnaire (Fig. 20.3), it can be seen that their perception on excitement also increases during the task. However, the first designer (orange marks) says that his excitement is stable during the selection and representation of the solution, but the box and whiskers plot shows that his excitement still had a fluctuation and maybe the perception of stable excitement is not easy to identify. Designer 2 said that he felt an occasional increase in his excitement until the end, when it became stable, which agrees with the data collected (Fig. 20.5), since excitement is less dispersed. On comparing the two designers, it is observed that the design problem is equally interesting for both of them and both have increased the level of excitement during the task, but the second designer was more excited than the first.
Figure 20.6 represents the data for the parameter “meditation” collected for the two designers. Two of the sensors of Designer 1 turned orange in the phase of “representing the solution”, which means that the data acquired may not be reliable. In this particular case, they do seem to affect the measurement of meditation, as can be seen in the graph, in which no variation of data is measured. According to Fig. 20.6, the median of meditation changed slightly during the design task but occasional increments were measured. These data contrast with the responses to the questionnaires, which show that concentration has been increasing throughout the design task for both designers. The reason for this could be that the designers have equated peaks of high levels of concentration with stable concentration during the design stage. The concentration levels are similar in both designers, as could be expected considering that they have a similar profile and they work on the same projects.
5 Discussion and Conclusions
The paper shows a methodological approach for contrasting hypotheses by measuring different emotional parameters of designers during the idea generation phase. Such hypotheses include concepts such as: is there one design method that causes more excitement in designers than another? And frustration? Does this happen to all designers or does it vary depending on their personality profiles? Is there an interaction between emotional responses and the quality of the design results? In order to perform the measurement in a direct way and in real-time, the use of EEG or EPOC headsets is proposed. In our study, the Emotiv EPOC neuroheadset was chosen, as it provides direct data, allows the designers freedom of movement, and has a relatively low-cost. It has also been used in several recent studies. In order to set guidelines, times, and rests, a study of the state of the art of similar experiments or experiences was performed. Moreover, the last step consisting in a questionnaire was also established in order to compare the results achieved with direct measurement and to obtain the participants’ feedback.
An experiment was performed to test the methodology and the equipment, thanks to the collaboration of two professional designers from the Vitale Design Studio. After the questionnaire in step 5 of the methodology, the researchers conducted an interview with the designers in order to get first-hand feedback about the methodology and the way the experiment was conducted. From this feedback, the usability of the tool becomes apparent, since the designers could carry out their design activity normally, and they were able to move about without any difficulty. The designers consider that they had enough time to work on concept generation, but they do not think the time will be enough if the idea needs to be expressed with the quality required for it to be evaluated later. That is, if future experiments need only to register the designer’s emotions without later having to analyze the solutions presented, 25 min per problem is enough for steps 2 and 4 of the methodology. On the other hand, if the problem results have to be presented correctly, more time must be assigned to these steps. As a result of testing the methodology, some advice and considerations can be postulated in order to improve future research using this methodology, as well as to avoid incorrect data recording. First of all, the selected tool is stable against most electromagnetic signals, mobile phones, wifi, etc., but it is not so stable with Bluetooth signals. As communication between the neuroheadset and the computer is achieved by Bluetooth, the system can record noise or even lose the signal when there are other Bluetooth signals close to them. Nonetheless, despite the fact that the neuroheadsets work with Bluetooth, the proximity of various neuroheadsets does not cause interferences between them if and when the virtual line between each neuroheadset and its corresponding receiver is not crossed by another one. This fact has to be taken into special consideration when planning experiments for design teams. Therefore, each designer must have their zone clearly delimited and not cross the other designer’s virtual zone. The authors also recommend performing the experiments in a Bluetooth-isolated area.
As the sample size in the test consisted of only two designers, no confluent data can be discussed about the data analysis. Nonetheless, the aim of the research was not to compare any hypothesis against the data recorded, so this aspect is left for future research.
There is no other direct method for analyzing the emotions of designers during their design process. The advantage of the proposed method over other possibilities is the free movement of designers when using the suggested device compared with the EEG devices with wires, and that the information is objectively obtained from the source, avoiding the personal interpretation of their own feelings, that can vary from one individual to another.
So, the proposed method seems suitable for measuring different emotions, distinguished by type and intensity, in designers that need freedom of movement in order to perform their design activity. Moreover, the conversion into numerical data allows the statistical analysis of the results in order to contrast different hypotheses. Hence, as future lines of work, the proposed methodology will be applied to measure the emotions of designers when working, both individually or in design teams, during the creative design phase in order to test different hypotheses, such as whether designers’ feelings, emotions or mood are reflected in their jobs, if they affect the design results or the level of creativity achieved, or whether the kind of creative method employed during the design work (for example, more structured or more intuitive) causes different reactions in designers depending on their personality.
References
Akinola M, Mendes WB (2008) The dark side of creativity: Biological vulnerability and negative emotions lead to greater artistic creativity. Personality and Social Psychology Bulletin
Arroyo I, Cooper DG, Burleson W, Woolf BP, Muldner K, Christopherson R (2009) Emotion sensors go to school. AIED 200:17–24
Bayer M, Schacht A (2014) Event-related brain responses to emotional words, pictures, and faces–a cross-domain comparison Frontiers in psychology 5
Bradley MM, Lang PJ (1994) Measuring emotion: the self-assessment manikin and the semantic differential. J Behav Ther Exp Psychiatry 25(1):49–59
Coan JA, Allen JJ (2007) Handbook of emotion elicitation and assessment. Oxford university press
Cooper DG, Arroyo I, Woolf BP, Muldner K, Burleson W, Christopherson R (2009) Sensors model student self concept in the classroom. In: Modeling User (ed) Adaptation, and personalization. Springer, Berlin, Heidelberg, pp 30–41
Debener S, Minow F, Emkes R et al (2012) How about taking a low-cost, small, and wireless EEG for a walk? Psychophysiology 49:1617–1621
Desmet PMA (2012) Faces of product pleasure: 25 positive emotions in human-product interactions. Int J Des 6(2):1–29
Desmet PMA, Hekkert P (2009) Special issue editorial: design & emotion. Int J Des 3(2):1–6
Florea A, Kalisz E (2005) Embedding emotions in an artificial tutor. In: Symbolic and numeric algorithms for scientific computing, 2005. SYNASC 2005. Seventh international symposium on, 6. IEEE
Hutton E, & Sundar SS (2010) Can video games enhance creativity? Effects of emotion generated by Dance Dance Revolution. Creativity Res J, 22(3):294–303
Inventado PS, Legaspi R, Bui TD, Suarez M, (2010), Predicting student’s appraisal of feedback in an its using previous affective states and continuous affect labels from EEG data. In: Proceedings of the 18th international conference on computers in education, Putrajaya, Malaysia
Jackson MM, Mappus R (2010) Applications for brain-computer interfaces. Brain-computer interfaces. Springer, London, pp 89–103
Jordan PW (1998) Human factors for pleasure in product use. Appl Ergono 29(1):25–33
Jordan PW (2000) Designing pleasurable products. An introduction to the new human factors. Taylor and Francis. London
Lang M (2012) Investigating the Emotiv EPOC for cognitive control in limited training time. Honours report, University of Canterbury, 8
Martín H, Bernardos AM, Tarrío P, & Casar JR (2011) Enhancing activity recognition by fusing inertial and biometric information. In 14th International Conference on Information Fusion (pp. 1-8). IEEE
Mauss IB, Robinson MD (2009) Measures of emotion: a review. Cogn Emot 23(2):209–237
McDonagh D, Bruseberg A, Haslam C (2002) Visual product evaluation: exploring users’ emotional relationships with products. Appl Ergon 33(3):231–240
Moridis CN, Economides AA (2008) Toward computer-aided affective learning systems: a literature review. J Educat Comput Res 39(4):313–337
Motte D (2009) Using brain imaging to measure emotional response to product appearance. In: 4th international conference on designing pleasurable products and interfaces-DPPI’09 (pp 187–198). Université de Technologie de Compiègne (UTC)
Na N, Suk HJ (2014) The emotional characteristics of white for applications of product color design. Int J Des 8(2):61–70
Nakamura J, Csikszentmihalyi M (2009) Flow theory and research. Handbook of positive psychology, 195–206
Oatley K, Keltner D, Jenkins JM (2006) Understanding emotions. Blackwell publishing
Ortiz JC, Aurisicchio M, Desmet PMA (2014) Pleasantness and arousal in twenty-five positive emotions elicited by durable product. In: The 9th international conference on design and emotion, Ediciones Uniandes, Bogotá, Colombia, 221–227
Osgood CE, Suci GJ, Tannenbaum PH (1957) The measurement of meaning. University of Illinois Press, Urbana
Partala T, Kangaskorte R (2009) The combined walkthrough: measuring behavioral, affective, and cognitive information in usability testing. J Usability Stud 5(1):21–33
Pham TD, Tran D (2012) Emotion recognition using the emotiv epoc device. In Neural information processing (pp. 394–399). Springer Berlin, Heidelberg
Ramirez R, Vamvakousis Z (2012) Detecting emotion from EEG signals using the emotive epoc device. Brain Informatics. Springer, Berlin, Heidelberg, pp 175–184
Rodríguez E (2014) Industrial design strategies for eliciting surprise. Des Stud 35(3):273–297
Rodríguez Bermúdez G, García Laencina PJ, Brizion D, Roca Dorda J (2013) Adquisición, procesamiento y clasificación de señales EEG para diseño de sistemas BCI basados en imaginación de movimiento. VI Jornadas de introducción a la investigación de la UPCT 6:10–12
Schmitt B (2010) Experience marketing: concepts, frameworks and consumer insights. Found Trends ® Mark 5(2):55–112
Sun L, Xiang W, Chai C, Yang Z, Zhang K (2014) Designers’ perception during sketching: an examination of creative segment theory using eye movements. Des Stud 35(6):593–613
Terzis V, Moridis CN, Economides AA (2013) Measuring instant emotions based on facial expressions during computer-based assessment. Pers Ubiquit Comput 17(1):43–52
Vergara M, Mondragón S (2008) Ingeniería Kansei: una potente metodología aplicada al diseño emocional. Faz 2:49–56
Yoon J, Desmet PMA, van der Helm A (2012) Design for interest: Exploratory study on a distinct positive emotion in human-product interaction. Int J Des 6(2):67–80
Acknowledgments
This research has been possible thanks to the project GV/2017/098 “creación de espacios emocionales para incrementar los resultados creativos del diseñador durante la fase conceptual” founded by the Generalitat Valenciana government.
Authors would also like to express their gratitude to the staff members of Vitale for their cooperation in this study. This research complied with the American Psychological Association Code of Ethics and was approved at the University Jaume I. Informed consent was obtained from each participant.
Author information
Authors and Affiliations
Corresponding author
Editor information
Editors and Affiliations
Rights and permissions
Copyright information
© 2021 Springer Nature Switzerland AG
About this paper

Cite this paper
Chulvi, V., Gual, J., Mulet, E., Galán, J., Royo, M. (2021). A Methodological Approach to Analyzing the Designer’s Emotions During the Ideation Phase. In: Ayuso Muñoz, J.L., Yagüe Blanco, J.L., Capuz-Rizo, S.F. (eds) Project Management and Engineering Research. Lecture Notes in Management and Industrial Engineering. Springer, Cham. https://doi.org/10.1007/978-3-030-54410-2_20
Download citation
DOI: https://doi.org/10.1007/978-3-030-54410-2_20
Published:
Publisher Name: Springer, Cham
Print ISBN: 978-3-030-54409-6
Online ISBN: 978-3-030-54410-2
eBook Packages: EngineeringEngineering (R0)