
Abstract
The ultrahigh-basicity (R = 1.75) mold flux has been proved to be effective in coordinating heat transfer and lubrication during continuous casting of peritectic steel in industry, Properties of the mold flux may be further improved through the adjustment of the Li2O content in the flux . The effects of Li2O content on the properties of ultrahigh-basicity mold flux were systematically investigated. With the increase of the Li2O content from 0.8 to 2.4%, the viscosity of the ultra-high basicity mold flux at the temperature of 1573 K increased and then decreased, and the maximum viscosity was 0.148 Pa·s at the Li2O content of 2.0%. With the increase of the Li2O content from 0.8 to 2.4%, the break temperature was reduced from 1484 to 1435 K, the initial crystallization temperature , which was measured by an in-house apparatus, could decline by approximately 100 K with 2.4% Li2O addition while the crystallization rate represented an increasing trend except for the case with 2.0% Li2O . This study enhances the understanding of specified mold flux for peritectic steel .
Access provided by Autonomous University of Puebla. Download conference paper PDF
Keywords
Introduction
Mold fluxes have been indispensable metallurgical material in the continuous casting process since they appeared in the 1960s. They are critical to ensure continuous casting and improve the surface quality of slab. The most important function of mold fluxes is to control the heat transfer as well as lubricate solidified shells [1,2,3,4]. The realization of these functions is highly related to the viscosity , the melting temperature and the crystallization properties of the slag [2, 5]. Longitudinal cracks often occurred on the slab surface of peritectic steel with the carbon content of 0.08–0.16% of continuous casting, resulting from the peritectic reaction with 4.7% volume contraction [6, 7]. The ultra-high basicity mold flux (R = 1.75) with low break temperature and rapid crystallization rate has been developed to reduce the occurrence of longitudinal cracks [8, 9]. The improvement of the heat transfer and lubrication of the ultra-high basicity mold flux was related to the Li2O addition into the flux . In general, Li2O was a kind of alkaline metal oxide which could significantly reduce the melting temperature and the viscosity [9, 10]. Besides, it also deeply affected the crystallization behavior of mold flux . However, to date, only a few studies concentrate on Li2O , especially with respect to its crystallization. In a study employing the double hot thermocouple technique (DHTT), Lu [11] found that the Li2O can suppress crystallization via decreasing the initial crystallization temperature in the CaO-Al2O3 mold fluxes for the casting of high-Al steels. On the contrary, Yang [12] determined that the Li2O can enhance the crystallization capability by improving the crystallization fraction in a CaO-SiO2-Al2O3 mold flux with 8% Na2O through differential scanning calorimetry (DSC) measurements. MYUNG-DUK SEO [13] reported that the initial crystallization temperature decreased with Li2O addition in CaO-SiO2-Al2O3-Na2O-CaF2 -Li2O mold fluxes. It was demonstrated that the influences of Li2O were complex in various mold fluxes. Therefore, it is necessary to systematically investigate the influence of Li2O on the properties of ultrahigh-basicity mold fluxes.
Experimental Apparatus and Procedures
Materials
Five mold fluxes with different Li2O content were investigated. All the fluxes were prepared by melting pure chemical reagents (CaCO3, SiO2, CaF2 , Na2O, Li2CO3 MgO , Al2O3, Fe2O3). The basicity of mold fluxes were approximately 1.75, and the Li2O content was within 0–2.4%. In order to resemble the condition in steel plant, some Fe2O3 was added into the five mold fluxes, whose specific compositions were shown in Table 1.
Experimental Methods
-
(1)
In the current study, the viscosity , the break temperature , and the melting temperature of the ultra-high basicity mold flux were measured through the rotating cylinder method [8], and hemisphere point method [8], respectively.
-
(2)
The crystallization properties of ultrahigh-basicity mold fluxes were investigated by digital optical microscopy with an isolated observation system in an infrared furnace (IR-MOP). As shown in Fig. 1, a halogen lamp was applied to heat the sample. The crystallization process was recorded by digital microscopy with a wide field of view. The equipment can effectively avoid the volatilization of fluorides with a quartz glass over the platinum crucible. Besides, the ToupView software can adjust the color, contrast, and brightness of the images in a suit to avoid the high temperature irradiation interference.
Fig. 1 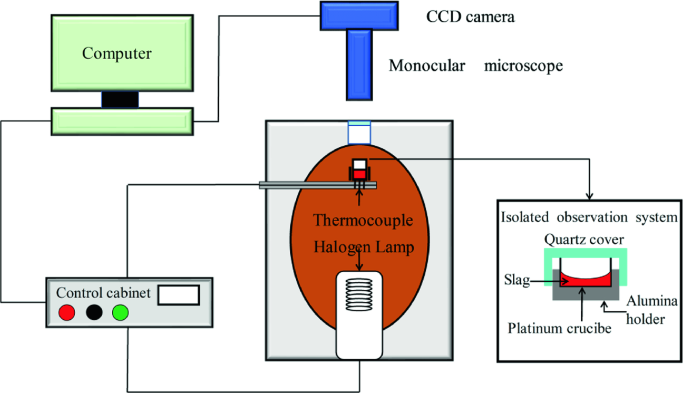
Schematic of experimental devices

In every experiment, a 6–80 mg mold powder from the mold flux CSF 1–CSF 5 was heated through the IR-MOP apparatus to 1300 °C at the heating rate of 10 °C/s and held for 60 s to eliminate bubbles and homogenize the chemical composition. Then, the sample was cooled to room temperature at the rate of 1, 2, 3, 4 °C/s. The phase transformation from molten to the crystalline state was observed and recorded via the CCD camera. The temperature of sample was monitored and recorded using the temperature acquisition system. The image processing software Photoshop was used to measure the crystallinity of the flux . Afterwards, based on the relationships among the temperature , time, and phase fraction a CCT diagram was constructed. At the 5% degree of crystallinity, the corresponding temperature was defined as the initial crystallization temperature . When the degree of crystallinity reached 85%, the corresponding temperature was defined as the end of crystallization temperature .
Results and Discussion
In Figure 2, the viscosity -temperature curves of ultra-high basicity mold fluxes with different Li2O contents was shown. The viscosity at 1300 °C, the break temperature and the melting temperature were recorded in Table 2, with the increase of Li2O content in the mold fluxes from 0 to 2.4%, the viscosity at 1300 °C increased from 0.034 to 0.148 Pa s and then decreased to 0.109 Pa s. The break and the melting temperatures decreased from 1232 °C to 1162 °C and 1192 °C to 1068 °C, respectively.

Viscosity -temperature cures of ultra-high basicity mold fluxes with different Li2O contents
The CCT diagrams from the relationship among the temperature , time and crystallization fraction of CSF1–CSF5 was shown in Fig. 3. With the increase of the Li2O content from 0 to 2.4%, at the cooling rate of 1 °C/s, the initial crystallization temperatures were 1225 °C, 1173 °C, 1155 °C, 1145 °C, and 1116 °C, respectively. At the higher cooling rate, namely 4 °C/s, the initial crystallization temperatures were 1194 °C 1161 °C, 1143 °C, 1114 °C, and 1060 °C, respectively. With the gradual increase of Li2O by 0.8%, the initial crystallization temperature decreased on average by 42 °C. Additionally, with the increase of the cooling rate, the decrease of the initial crystallization temperature was also observed. This observation was related to the high viscosity and iron migration resistance in mold fluxes as a function of decreased temperature . Therefore, the formation of crystals required a large degree of undercooling.

CCT diagrams of Ultra-high basicity mold fluxes with different Li2O contents
The crystallization process is related to both nucleation and crystal growth rate, relationships of temperature , and the degree of undercooling. Therefore, the detailed kinetics analysis is discussed below in the next chapter.
Analysis Through Avrami Equation
Avrami equation [14] has been widely used in the study of crystallization kinetics of mold fluxes. The theory is based on the assumption that the non-isothermal crystallization process which has a constant cooling rate can be approximated as an isothermal crystallization process. The specific equation is:
where X(t) represents the relative crystallinity at a given time, Zt is the compound crystallization rate constant, and NA is the Avrami exponent. The relative crystallinity and the compound crystallization rate are related to the temperature , the rate of nucleation, and crystal growth. The value of NA was the slope from the plots of ln[-ln(1-X(t))] versus lnt.
Plots of ln[-ln(1-X(t))] and lnt with different Li2O contents in ultra-high basicity mold fluxes are demonstrated in Fig. 4. It should be mentioned that, the plots based on the Avrami equation are not linear, which verified the inappropriateness of Avrami equation in describing the non-isothermal crystallization process of mold fluxes. However, it does not affect the calculation that Avrami exponent. Actually, NA is a function of crystallinity, temperature , and the cooling rate in the non-crystallization process. Therefore, compared with the isothermal crystallization, it does not have physical meaning. However, it can be employed to obtain the non-isothermal crystallization kinetics parameter No, associated with the m value in the Mo equation [14]. Besides, there is a positive correlation between No and the crystallization rate, the higher the No, the faster the crystallization speed and the stronger the crystallization ability.

Plots between ln[-ln(1-X(t))] and lnt with different Li2O content of a 0%, b 0.8%, c 1.6%, d 2.0% and e 2.4% under different cooling rates
Analysis Through Mo Equation
The Mo equation [14] is also commonly employed in non-isothermal analysis of mold flux .
where Ф is the cooling rate, and F(T) is the crystallization rate constant. The crystallization rate constant is related to both the crystallinity and the cooling rate and has a negative correlation with the crystallization rate, which means the higher the No, the slower the crystallization speed and the weaker the crystallization ability. The No mentioned above can be obtained by m = NA/NO. The relationships between lnФ and lnt of CSF1–CSF5 were presented in Fig. 5. All plots show a good linear relationship between lnФ and lnt, which verifies the applicability of the Mo equations in describing the non-isothermal crystallization process of ultrahigh basicity mold fluxes.

Relationship between lnФ and lnt for non-isothermal crystallization of different Li2O contents in ultra-high basicity mold fluxes
Relationships between crystallization fraction and lnF(T) as well as, crystallization fraction and No from Mo equation are shown in Figs. 6 and 7, respectively. Figure 6 shows that with the increase of Li2O content from 0 to 2.4%, the lnF(T) increased and then decreased, reaching the maximum at the Li2O content of 2.0. It was indicated that the Li2O could suppress the crystallization with the addition of less than 2.0%. The non-isothermal crystallization kinetic parameter No firstldecreased with the content of Li2O below 2.0%, and then increased rapidly when the content exceeded 2.0%. Therefore, the opposite trends between lnF(T) and NO indicated similar results.

Non-isothermal crystallization kinetic parameter lnF(T) based on MO equation of ultra-high basicity mold fluxes of CSF1–CSF5

Non-isothermal crystallization kinetic parameter No based on MO equation of ultra-high basicity mold fluxes of CSF1–CSF5
Conclusions
Effects of the Li2O content on properties of ultra-high basicity mold fluxes were systematically investigated. The viscosity at 1300 °C, the break and the melting temperatures, as well as, the crystallization properties were measured. Results are summarized as follows:
-
(1)
With the increase of Li2O content in mold fluxes from 0 to 2.4%, the viscosity at 1300 °C increased from 0.034 to 0.148 Pa s and then decreased to 0.109 Pa s. The break temperature decreased from 1232 to 1162 °C, and the melting temperature from 1192 to 1068 °C.
-
(2)
With the increase of the Li2O content from 0 to 2.4%, at the cooling rate of 1 °C/s, the initial crystallization temperatures were 1225 °C, 1173 °C, 1155 °C, 1145 °C, and 1116 °C, respectively. At the cooling rate of 4 °C/s, the initial crystallization temperatures decreased from 1194 to 1060 °C. With the gradual increase of Li2O by 0.8%, the initial crystallization temperature decreased in average by 42 °C.
-
(3)
The non-isothermal crystallization kinetic parameter lnF(T) and No were obtained by Mo equation which is associated with the Avmavi equation. The lnF(T) increased with the Li2O content from 0 to 2.0%. However, the No decreased when Li2O content was less than 2.0%. The results No and lnF(T) showed that the Li2O can suppress the crystallization when the Li2O content was below 2.0%, On the other hand, the higher Li2O content (>2.0%) has promoted the crystallization.
References
Mills KC, Däcker CÅ (2017) The casting powders book. Springer, Berlin
Mills KC, Fox AB (2003) The role of mould fluxes in continuous casting so simple yet so complex. ISIJ Int 43(10):1479–1486
Mills KC et al (2013) Performance and properties of mould fluxes. Ironmaking Steelmaking 32(1):26–34
Nakada H, Nagata K (2006) Crystallization of CaO–SiO2–TiO2 slag as a candidate for fluorine free mold flux. ISIJ Int 46(3):441–449
Shaoda Z, Li M, Lilong Z (2019) Effect of substituting Na2O for SiO2 on the non-isothermal crystallization behavior of CaO-BaO-Al2O3 based mold fluxes for casting high Al steels. Ceram Int 45(9):11296–11303
Gu S, Wen G, Ding Z (2018) Effect of shear stress on isothermal crystallization behavior of CaO-Al2O3-SiO2-Na2O-CaF2 slags. Materials (Basel) 11(7)
Xu J, He S, Wu T (2012) Effect of elements on peritectic reaction in molten steel based on thermodynamic analysis. ISIJ Int 52(10):1856–1861
Long X, He SP, Xu JF (2012) Properties of high basicity mold fluxes for peritectic steel slab casting. Ironmaking Steelmaking 19(7):39–45
Long X, Wang Q, He S (2017) Structure evolution of slag films of ultrahigh-basicity mold flux during solidification. Metall Mater Trans B 48(4):1938–1942
He MY, Wang Q, Hu B (2016) Application of high-basicity mould fluxes for continuous casting of large steel slabs. Ironmaking Steelmaking 43(8):588–593
Lu B, Chen K, Wang W (2014) Effects of Li2O and Na2O on the crystallization behavior of lime-alumina-based mold flux for casting high-al steels. In: Minerals, metals materials society and ASM international 2014, vol 45B, pp 1496–1509
Yang C, Wen G, Tang P (2015) Effect of Li2O on crystallization of mold fluxes for continuous casting of high aluminum steel. ICS
Seo M-D et al (2014) Crystallization behaviors of CaO-SiO2-Al2O3-Na2O-CaF2-(Li2O-B2O3) mold fluxes. Metall Mater Trans B 45(5):1874–1886
Shi CB, Seo MD, Wang H (2014) Crystallization kinetics and mechanism of CaO–Al2O3-based mold flux for casting high-aluminum TRIP steels. Metall Mater Trans B 46(1):345–356
Acknowledgements
This work was financially supported by the National Science Foundation of China (project no. 51874057).
Author information
Authors and Affiliations
Corresponding author
Editor information
Editors and Affiliations
Rights and permissions
Copyright information
© 2020 The Minerals, Metals & Materials Society
About this paper

Cite this paper
Li, M., Wu, Y.b., He, S.p., Wang, Q.q., Wang, Q. (2020). Influences of Li2O on the Properties of Ultrahigh-Basicity Mold Fluxes for Continuous Casting of Peritectic Steel. In: Peng, Z., et al. 11th International Symposium on High-Temperature Metallurgical Processing. The Minerals, Metals & Materials Series. Springer, Cham. https://doi.org/10.1007/978-3-030-36540-0_63
Download citation
DOI: https://doi.org/10.1007/978-3-030-36540-0_63
Published:
Publisher Name: Springer, Cham
Print ISBN: 978-3-030-36539-4
Online ISBN: 978-3-030-36540-0
eBook Packages: Chemistry and Materials ScienceChemistry and Material Science (R0)