
Abstract
The automatic segmentation of retinal vessels plays an important role in the early screening of eye diseases. However, vessels are difficult to segment with pathological retinal images. Hence, we propose the use of deep U-net, a new retinal vessel segmentation method based on an improved U-shaped fully convolutional neural network. The method uses not only local features learned from the shallow convolution layers, but also abstract features learned from deep convolution layers. To improve the segmentation accuracy for thin vessels, we applied Gaussian matched filtering to the U-net. The batch normalization layer was added in the U-net network, which increased the speed of convergence. In the training phase, a new sample amplification method called translation-reflection was proposed to increase the proportion of blood vessels in the training images. Results of the experiments showed that the proposed method leads to better retinal vessel segmentation than other methods developed in recent years do for the SE, SP, Acc, Ppv, and AUC evaluation metrics.
The work was supported by the National Key Research and Development Program of China (No. 2017YFC170302) and the Science and Technology Project of Beijing Municipal Education Commission (No. KM201710005028).
Access provided by Autonomous University of Puebla. Download conference paper PDF
Keywords
1 Introduction
Diseases such as glaucoma, cataracts, and diabetes cause retinal fundus blood vessel lesions and can cause pain and even blindness for long-term patients with these diseases [1]. Manual vessel segmentation is important for the detection of these eye diseases, but segmentation by experienced experts is cumbersome and time-consuming. Therefore, automatic extraction of retinal blood vessels from images is particularly important. Automatic segmentation is difficult because of inadequate contrast regions, pathological regions, and background noise.
Recently, deep learning has been used in retinal vessel segmentation, and it has achieved promising results [2, 3]. It classifies retinal vessel segmentation at the pixel level, and it uses deep learning to achieve semantic segmentation and end-to-end tuning. These convolutional neural network-based segmentation methods, in which the size of image blocks is usually much smaller than the size of the whole image, limits the size of the perceptual region; this approach can only extract some local features, thus limiting the performance of segmentation. Additionally, this type of method has a high storage cost and computation efficiency is relatively low. To solve these problems, Fu et al. [4] proposed a deep learning method that regarded retinal vessel segmentation as a border extraction problem. By combining the deep convolution neural network with a fully connected conditional random field (CRF), the fusion images of the four-sided output vessel probability maps were input into CRF to complete the segmentation of the whole retinal image. Luo et al. [10] and Orlando et al. [11] proposed retinal vessel segmentation methods that used deep neural network for training and CRF for fine tuning, and they achieved better segmentation results. However, using fully connected CRFs complicates the network with many parameters, which requires high-performance training equipment and long-term training.
Dasgupta et al. [5] proposed an end-to-end retinal vessel segmentation method in which the retinal vessel image was divided into small pieces and the full convolution network (FCN) was applied to segmented retinal vessels. A segmentation method based on FCN uses a de-convolution layer to sample the feature map of the last convolution layer to restore it to the same size as the input image; therefore, it can classify the image at the pixel level and address the issue of semantic segmentation. However, an FCN does not fully use the information obtained from the shallow convolution layers, which have smaller perception domains and can learn some local features. A new fully convolutional neural network [6], called U-net [7], has been successfully applied to cell image segmentation; in this study, we use deep U-net for retinal vessel image segmentation, and propose an improved U-net-based retinal vessel segmentation method to achieve end-to-end retinal vessel segmentation.
2 Materials and Methods
Our experimental method is outlined in Fig. 1. In the training phase, the preprocessing processes included green channel extraction, contrast limited adaptive histogram equalization (CLAHE), and gamma correction. Gaussian matched filtering was applied before the network training to enhance the contrast of small blood vessels. To increase the number of training samples, five sample amplification methods were used (i.e., rotation, translation, stretching, flipping, and, our newly developed method, reflection). Amplified samples were used as the input for the deep U-net.

Retinal vessel segmentation process based on an improved U-net
The network consisted of convolution layers, lower sampling layers, and upper sampling layers, forming a left-right symmetrical, end-to-end, U-shaped network. It used a deeper network with four levels to expand the field of perception. At each level, the max-pooling operation was performed after the convolution layers and more abstract features were learned by down-sampling with maximum preservation. In the up-sampling stage, we used bilinear interpolation and the up-sampling network layer was connected with the corresponding shallow network layer at the same level; therefore, more information was maintained in the training process. Subsequently, we added the batch normalization (BN) layer in the U-net network to avoid over-fitting and to increase the speed of network convergence.
In the test phase, the test images were preprocessed using the same processes as the training phase. After Gaussian matched filtering, the image was input into the trained network model, and the output of the deep U-net was the segmentation result.
2.1 Gaussian Matched Filtering Method
Gaussian matched filtering can simulate the gray distribution of retinal vessels [12]. Our previous work [13] proved that Gaussian matched filtering can enhance small blood vessels in the image, which can improve small blood vessel segmentation accuracy. In our framework, the Gaussian kernels in 12 different directions are used to filter the retinal image, and the corresponding maximum response is found as the response value of each pixel, which is used as an input to the improved U-net. And the segmentation accuracy of the framework with and without filtering were compared to verify the validity of Gaussian matched filtering.
2.2 Image Amplification
Image amplification is usually required to enrich training samples because there are usually too few samples of retinal blood vessel segmentation images. In addition to the common image expansion methods, such as rotation, translation, stretching, and flipping, we used a new method, translation-reflection. When the translation amplification was performed, the images with 40 pixels translated in both horizontal and vertical directions always contained large background pixels. To overcome this problem, we use the reflection transformation along symmetrical axis of blood vessel distribution and its vertical direction at the circle boundary of the image. Therefore, the background parts were filled with vessel pixels of the symmetrical image, which increased the proportion of blood vessels in the image and moderately reduced the imbalance of positive and negative samples.
2.3 The Proposed Architecture: Improved Deep U-Net
The image samples after augmentation were input into the improved deep U-net, which extended the receptive field with a deeper network and extracted more abstract features.
-
(1).
Deep U-Net Network. The deep U-net network structure is shown in Fig. 2. C1, C2, C3 …C18 are all convolution layers. The max-pooling operation was performed with a 2 * 2 filter kernel for the M1, M2, M3, and M4 down-sampling layers; the maximum was preserved for deepening feature learning. Bilinear interpolation was performed for the up-sampling layers U1, U2, U3, and U4. To increase the spatial dimension of the structured output, the up-sampling layers, U1, U2, U3, and U4, were connected with the corresponding shallow network layers, C8, C6, C4, and C2, using the concat mode, which merged the feature maps from the shallow and deep layers. Two 1 * 1 convolution kernels were used in convolution layer C19. In the last layer, the software maximum was used for classification.
Fig. 2. 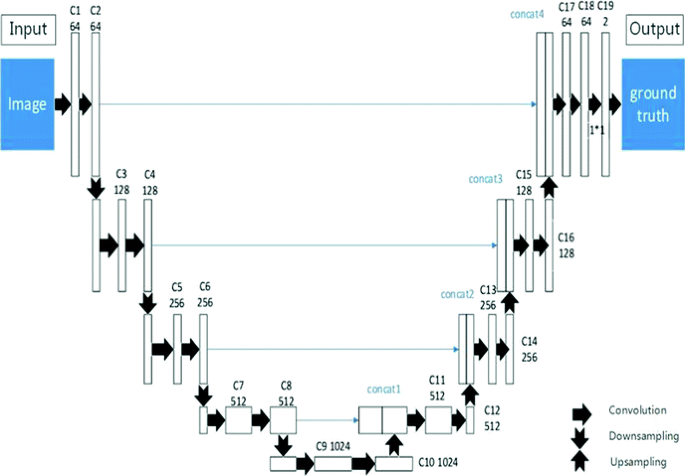
Network construction graph for the deep U-net
-
(2).
Batch Normalization. When the network becomes deeper, there are more parameters that need to be learned. In the U-net network training process, when the parameters of the previous layer changed, the data distribution received by the subsequent network layers also changed. With the deepening of the network, this change amplified, thus affecting the convergence rate of the network. To overcome this problem, a BN operation [14] was introduced before ReLU activation after convolution layers C1, C3, C5, C7, and C9, so the network layer data were normalized to a uniform distribution; this had minimal effect on the latter layers and it avoided slow network convergence caused by learning a different data distribution. Moreover, BN is very effective for gradient feedback transmission and has the effect of regularization, which prevents the network from over-fitting the data.

We chose a relatively large initial learning rate because the BN layer had an effect on the convergence speed of the network, so we did not need to adjust the learning rate incrementally. The convergence rates of the networks with and without BN were compared. We compared the convergence speeds of network training with BN and Dropout, a stochastic regularization strategy commonly used to prevent over-fitting of deep networks.
2.4 Databases and Evaluation Metrics
The retinal images used in the experiments were from the Digital Retinal Images for Vessel Extraction (DRIVE) and the Structured Analysis of the Retina (STARE) databases. The preprocessing processes included green channel extraction, CLAHE, and the gamma correction, which differentiate blood vessel from the background. In the evaluation of blood vessel segmentation methods, we used sensitivity (Se), specificity (Sp), accuracy (Acc), precision rate (Ppv), and the area under receiver operating characteristic curve (AUC) to evaluate the proposed method and compare it with other methods. Where, Sensitivity (Se) represents the proportion of correctly segmented vascular pixels in the total number of vascular pixels in the standard image, Specificity (Sp) represents the proportion of non-vascular pixels correctly segmented in the segmented image in the total number of non-vascular pixels in the standard image, The precision rate (Ppv) represents the proportion of vascular pixels correctly segmented in the segmented image in the total number of vascular pixels segmented.
3 Result
3.1 The Effect of Translation-Reflection Transformation
Of the 4000 images selected from the training samples, the images after translation-reflection transformation accounted for 0, 1/4, 1/2, and 3/4 of the total samples. After network training, the segmentation accuracy of the test set was calculated. The results of the experiment are shown in Table 1.
The segmentation accuracy of the test set clearly increased with increasing translation-reflection samples, which shows that increasing the content of blood vessels (positive samples) in the image with translation-reflection transformation helps to distinguish blood vessels from the background in the whole training network. When the number of translation-reflection samples increased to 3000, the segmentation accuracy slightly decreased, indicating that the proportion of translation-reflection samples was not an improvement. It is necessary to work with other amplification methods to expand the network’s ability to identify blood vessels in various situations. In subsequent experiments, we used Sample distribution.
3.2 Merging the Gaussian Matched Filtering with the U-Net Network
The segmentation result using Gaussian matched filtering of retinal images as training samples is clearly closer to the blood vessel graph manually segmented by experts (Fig. 3). For example, in the red ellipse 2, Gaussian matched filtering successfully segmented the cross-vessel while the method without Gaussian matched filtering clearly did not segment the cross-vessel. Gaussian matched filtering can also improve the segmentation accuracy of small blood vessels. The micro-vessels in red ellipse 1 are not segmented without Gaussian matched filtering and during manual segmentation by an expert. However, Gaussian matched filtering provided a better result. In our specific region of interest, the segmentation results using Gaussian matched filtering distinguish the edge of this area (i.e., the position shown in the blue box); this also shows that using the images processed by Gaussian matched filtering on training samples has improved segmentation.

Segmentation results of one example image (a) original image; (b) ground truth; (c) segmentation results of an image without Gaussian matched filtering; and (d) segmentation results of an image using Gaussian matched filtering (the red ellipses indicate specific areas where we compared the four images. The blue squares indicate specific areas where we compared the methods with or without Gaussian matched filtering (Color figure online)
The evaluation of the Gaussian matched filtering is shown in Table 2. Each index of the non-Gaussian matched filtering is smaller than the index of the Gaussian matched filtering, which indicates that the Gaussian matched filtering method can effectively improve the accuracy of vessel segmentation.
3.3 Analysis for Batch Normalization
The results of the comparison between BN and Dropout are shown in Fig. 4. The green curve represents the training process of the network using Dropout. The red curve represents the training process of the improved U-net network with BN layers. The blue curve represents the accuracy of the training process after introducing the BN layers. The network using Dropout shows decreasing loss after 300 iterations. However, the convergence speed improved after adding BN layers and the loss stabilized to less than 0.1 after iterations less than 300; this can avoid over-fitting and save training time.

The training curve before and after adding batch normalization
3.4 Comparison with Other Methods
Table 3 shows the comparison of our proposed vessel segmentation method with other deep learning methods [3, 5, 8, 9]. The results in Table 3 show that our proposed method is superior to the methods we studied for the SE, SP, Acc, Ppv, and AUC evaluation metrics. Our proposed algorithm applied a better training dataset and used an improved deep U-net network to obtain more abstract features, which combined shallow information to obtain better segmentation.
Our method may also be helpful for some difficult cases. It can achieve good results in the segmentation of small vessels, vessels in lesion images, and vessels with central reflection, as shown in Fig. 5. Figure 5(a) is an image with many small blood vessels in the vicinity of the macula; the reflex arcs near the optic disc were successfully identified as non-blood vessels using our method (e.g., the blue ellipse in Fig. 5(a)). Figure 5(b) shows successful separation of blood vessels from the background for an image containing a lesion using our proposed method, and our method did not incorrectly identify the lesion area as a dense vessel patch, which is a common error in traditional feature extraction methods. Figure 5(c) shows that our method identified the vessels with central reflex.

Segmentation images with small blood vessels, lesions, and vessel central reflex (Color figure online)
4 Conclusions
We proposed and tested a retinal blood vessel segmentation method based on an improved U-net network. to segment blood vessels of retinal images quickly and accurately. We used a new sample amplification method, which increased the proportion of blood vessels in the image after translation using reflection transformation; this reduced the imbalance between positive and negative samples in the image. By introducing BN layers in the U-net network, we prevented over-fitting, and the convergence speed of the network was also accelerated. In addition, the combination of the deep U-net network and traditional Gaussian matched filtering improved the accuracy of the segmentation. This method achieved end-to-end vascular segmentation of the whole retinal image. Furthermore, it produced accurate results, and the efficiency of network training improved; it also achieved good results in the segmentation of small vessels, lesion images, and vessels with central reflex.
References
Fraz, M.M., Remagnino, P., Hoppe, A.: Blood vessel segmentation methodologies in retinal images–a survey. Comput. Methods Programs Biomed. 108(1), 407–433 (2012)
Wang, S., Yin, Y., Cao, G., et al.: Hierarchical retinal blood vessel segmentation based on feature and ensemble learning. Neurocomputing 149, 708–717 (2015)
Melinscak, M., Prentasic, P., Loncaric, S.: Retinal vessel segmentation using deep neural networks. In: Proceeding of the 10th International Conference on Computer Vision Theory and Applications (VISAPP), pp. 577–582 (2015)
Fu, H., Xu, Y., Wong, D.W.K.: Retinal vessel segmentation via deep learning network and fully-connected conditional random fields. In: IEEE International Symposium on Biomedical Imaging, pp. 698–701 (2016)
Dasgupta, A., Singh, S.: A fully convolutional neural network based structured prediction approach towards the retinal vessel segmentation (2016)
Long, J., Shelhamer, E., Darrell, T.: Fully convolutional networks for semantic segmentation. In: CVPR, pp. 3431–3440 (2015)
Ronneberger, O., Fischer, P., Brox, T.: U-Net: convolutional networks for biomedical image segmentation. In: Navab, N., Hornegger, J., Wells, W., Frangi, A. (eds.) MICCAI 2015. LNCS, vol. 9351, pp. 234–241. Springer, Cham (2015). https://doi.org/10.1007/978-3-319-24574-4_28
Luo, Y.S.: From retinal image to diabetic retinopathy diagnosis. University of Electronic Science and Technology of China, Sichuan, China (2017)
Xie, L.: Blood vessel segmentation method for fundus images based on deep learning. Shenzhen University, Shengzhen, China (2017)
Orlando, J., Prokofyeva, E., Blaschko, M.: A discriminatively trained fully connected conditional random field model for blood vessel segmentation in fundus images. IEEE Trans. Biomed. Eng. 64(1), 16–27 (2016)
Luo, Y., Yang, L., Wang, L., Cheng, H.: CNN-CRF network for retinal image segmentation. In: The Third International Conference on Cognitive Systems and Information Processing (2016)
Chaudhuri, S., Chatterjee, S., Katz, N., et al.: Detection of blood vessels in retinal images using two-dimensional matched filters. IEEE Trans. Med. Imaging 8(3), 63–269 (1989)
Cai, Y., Gao, X., Qiu, C., Cui, Y.: Retinal vessel segmentation method with efficient hybrid features fusion. J. Electron. Inf. Technol. 39(8), 1956–1963 (2017)
Ioffe, S., Szegedy, C.: Batch normalization: accelerating deep network training by reducing internal covariate shift. In: ICML 2015 Proceedings of the 32nd International Conference on Machine Learning - Volume 37, Lille, France, 06–11 July 2015, pp. 448–456 (2015)
Author information
Authors and Affiliations
Corresponding author
Editor information
Editors and Affiliations
Rights and permissions
Copyright information
© 2019 Springer Nature Switzerland AG
About this paper

Cite this paper
Cai, Y., Li, Y., Gao, X., Guo, Y. (2019). Retinal Vessel Segmentation Method Based on Improved Deep U-Net. In: Sun, Z., He, R., Feng, J., Shan, S., Guo, Z. (eds) Biometric Recognition. CCBR 2019. Lecture Notes in Computer Science(), vol 11818. Springer, Cham. https://doi.org/10.1007/978-3-030-31456-9_36
Download citation
DOI: https://doi.org/10.1007/978-3-030-31456-9_36
Published:
Publisher Name: Springer, Cham
Print ISBN: 978-3-030-31455-2
Online ISBN: 978-3-030-31456-9
eBook Packages: Computer ScienceComputer Science (R0)