
Abstract
Capillary electrophoresis appeared to be a powerful and reliable technique to analyze the diversity of wine compounds. Wine presents a great variety of natural chemicals coming from the grape berry extraction and the fermentation processes. The first and more abundant after water, ethanol has been quantified in wines via capillary electrophoresis. Other families like organic acids, neutral and acid sugars, polyphenols, amines, thiols, vitamins, and soluble proteins are electrophoretically separated from the complex matrix.
Here, we will focus on the different methodologies that have been employed to conduct properly capillary electrophoresis in wine analysis.
Two examples informing on wine chemistry obtained by capillary electrophoresis will be detailed. They concern polyphenol analysis and protein profiling. The first category is a well-developed quantitative approach important for the quality and the antioxidant properties conferred to wine. The second aspect involves more research aspects dealing with microbiota infections in the vineyard or in the grape as well as enological practices.
Access provided by CONRICYT – Journals CONACYT. Download protocol PDF
Key words
1 Introduction
Numerous applications of capillary electrophoresis have grown since its first introduction in 1981 by Jorgenson and Lukacs [1]. They concern a variety of fields like pharmaceutical, food, or biological sciences requiring powerful and reliable analyses in complex matrices. Among them, wine presents a great variety of aromatic and nonvolatile compounds mixed within a highly diverse—yet partly unknown—oligomeric and macromolecular pool made of polysaccharides, proteins , and condensed tannins. Such diversity has been revealed with electrophoresis techniques involving conductimetric, amperometric, and photometric detection in the last two decades. Table 1 provides a non-exhaustive classification of the various wine compounds that have been separated by capillary electrophoresis with their analytical conditions including electrolyte composition and pH, capillary parameters, injection/detection modes, and limit of detection of each molecules.
Wine is a subtle matrix due to its direct acidic and ethanolic constitution. Low pH requires the use of alkaline buffer to facilitate the migration of phenolic type of wine constituents except strong organic acids . The presence of ethanol directly affects the viscosity of the electrolyte inside the capillary and modifies the electroosmotic flow of wine compounds facilitating the migration and improving analyte solubility [2]. However such organic modification of the electrolyte by ethanol renders unique the analysis of wine constituents not necessarily applicable to non-ethanolic samples like must, for instance.
1.1 Background Electrolyte Compositions
Phosphate or borate buffers with appropriated ionic strength and pH are mostly used electrolytes to separate a large class of wine compounds: flavonoids and non-flavonoids, amines, polypeptides, neutral sugars , vitamins, and cofactors. Wine polypeptides and soluble proteins have also been separated with tris(hydroxymethyl)aminoethane.
For the separation of acid sugars and organic acids, β-resorcylic acid, 2-(N-morpholino) ethanesulfonic acid, and dinitrobenzoic acid appeared to be good background electrolytes. However, additional organic flow modifiers, acting as cationic surfactant (tetradecyltrimethylammonium hydroxide, tetradecyltrimethylammonium bromide, or cetyltrimethylammonium bromide), have to be added to the buffer in order to reverse the electroosmotic flow and facilitate the separation of wine analytes.
Alternative methods also used other organic modifiers, such as methanol or acetonitrile, in order to alter the relative order of solute migration or selectivity [3–5].
Other electrophoretic methodologies were based on sodium dodecyl sulfate for the preparation of the electrolyte [6–9]. In this case, sodium dodecyl sulfate was used above its critical micellar concentration in order to build spherical micelles with the negatively charged sulfate groups pointing at the surface, thus providing additional partition between the pseudo-stationary phase and the electrolyte buffer for wine compounds. Such micellar electrokinetic chromatography clearly exhibited enhanced selectivity [6, 7, 10].
1.2 Detection of Wine Compounds
Wine electrophoresis mostly employs UV detection , either in the direct mode if wine compounds absorb in the UV or have been modified to present chromophores or in the indirect mode if wine compounds do not absorb UV radiation, as in the case of the detection of cations, acid sugars, and organic acids [11–13]. Conductimetry has also proven to efficiently detect wine organic acids [5]. Concerning important biologically peptides , amines, proteins, and vitamins that are present at trace levels in wine, laser-induced fluorescence appeared to be a powerful detector [7, 14, 15]. Very low limits of detection were reached, down to 20 pg/L in the case of glutathione [15]. Mass spectrometry has also been coupled to capillary electrophoresis for the detection of phenolic compounds in red wines [16], biogenic amines [17, 18], and protein contents [19, 20]. The only limitation when using this detection is that the running buffer should be volatile and compatible to electrospray, ion trapping, and time-of-flight implementations.
2 Applications of Capillary Electrophoresis to Wine Research
Capillary electrophoresis provides high resolution , is fast and simple technique, consumes very few reagents and samples, and requires minimum preparation of sample even in complex matrices. It can advantageously replace usual separative techniques like gas chromatography for volatile compounds [6], or liquid chromatography for flavonoids [21]. It can even go further in the separation of isomers in the case of sugars [4] or stilbene analyses [3, 22, 23]. Among wine compounds that have been precisely quantified in the last decades, flavonoids and non-flavonoid polyphenols take a large place in wine analyses [3, 14, 16, 21–24]. Peptides and proteins started to be explored but were not so much exploited to deepen wine research [9, 19, 20, 25–27]. Due to the difficulty to separate such analytes (or cationic analytes in general) new suitable capillary modification is the first stage to perform to reduce analyte—capillary interactions.
2.1 Enantiomeric Analysis
Qualitative observation on L-arabinose and D-galacturonic acid contents, obtained from Riesling wine electropherograms, enabled to differentiate vintages due to differences in fermentation routes, infection processes by Botrytis cinerea during the grape maturation, and enzyme treatments occurring during winemaking [4].
Trans-resveratrol and cis-resveratrol present in red wines are easily distinguishable by electrophoresis [3, 22]. Table 2 indicates concentrations for each enantiomer in red wines. Trans-resveratrol is the most abundant isomer, with concentrations ranging from 1 to 25.5 μmol/L. Generally trans- and cis-resveratrol is present in grapes in their glycosylated forms and aglycones can be released after hydrolysis during fermentation. Differences in concentrations can be attributed to the cultivar, the growing region, and the yeast strains. In general Merlot and Pinot Noir wines exhibited the highest contents of resveratrol. The highest resveratrol amount of 25.5 μmol/L was obtained for the Oregon Pinot Noir. Trans- and cis-Piceid, the glycosylated forms of resveratrol, has also been identified in red wines [23].
2.2 Quantitative Analysis: Polyphenolic Contents in Wines
Wines present a large amount of phenolic compounds that can be readily oxidized by significant amounts of oxygen. The total amount of phenolics is quickly obtained by the Folin-Ciocalteu colorimetric assessment, usually expressed as a concentration in mg of gallic acid equivalent per liter. Global concentrations spanning from 200 to 2000 mg/L were found, respectively, in white and red wines [28]. Simultaneously, individual polyphenolic identification and quantification could be achieved by means of a reliable analytical separative tool such as capillary electrophoresis. The key factor for the polyphenolic compounds to be separated is based on their charge-to-mass ratio, which is totally dependent on the electrolyte buffer pH and ionic strength.
Most of polyphenols have pKa comprised between 7 and 12, and in the presence of an appropriate buffer electrolyte with pH above 8, all phenolic substrates should be completely or partially ionized [29]. For that purpose, phosphate and borate buffers were mostly used for electrophoretic separations in wine. However, modification of the buffer ionic strength could affect the resolution and the analytical times [21].
As flavonoids and non-flavonoids are chromophoric structures, thanks to their aromatic rings, they are easily detectable spectrophotometrically with a diode array detector in the ultraviolet region.
2.3 Recent Advances in the Sulfur Chemistry of Wines
The diversity of yet-unknown sulfur compounds in wines has been described previously by ultrahigh-resolution FTICR-MS [30]. However, these results also emphasized the need for selective ionization strategies in order to overcome ion suppressions in the electrospray. Capillary electrokinetic fractionation (CEkF) was thus investigated as a simple and robust approach for semi-preparative and analytical sample analysis based on pKa-dependant pH-driven electrophoretic mobility [31]. Capillary electrokinetic fractionation/mass spectrometry (CEkF/MS): Technology setup and application to metabolite fractionation from complex samples coupled at line with ultrahigh-resolution mass spectrometry. In this study, CEkF was optimized with contactless conductivity detection and coupled on/at line to electrospray ionization (ESI) mass spectrometry (MS) . A semi-empirical model was proposed, based on the correlation between sample/medium pH regulating the partial charge and thus the electrokinetic loading of the capillary and intensity (I) of the highly resolved single-mass signals of the analytes as obtained after flow injection of the electrokinetically filled capillary into electrospray ion cyclotron-Fourier transform/mass spectrometry (ICR-FT/MS). According to the model, an empirical function (I = f (pH)) could be derived to calculate the acid dissociation constant (pKa) of various model compounds based on their pH-dependant MS intensity profiles. Using the ultrahigh resolution of ICR-FT/MS, the pKa model was further illustrated in real samples through the structure prediction of important compounds in wine for two different wine samples only differing by their age in bottle. The established CEkF was successfully used to selectively fractionate sulfur compounds from the complex wine samples, and it showed that S-containing compounds dominated the low-pH fractionations, especially in the old vintage, thus suggesting a specific stability of S-conjugated compounds over time. Moreover, the sulfur compounds found in low-pH fractionations were typically located in the van Krevelen area of sulfonated phenols and anthocyanins. The visualization indicated that CEkF conducted at extreme low pH preferentially orientates to sulfur compounds, which are highly polar and can be dissociated at extreme low pH. The proposed CEkF method is thus able to extract compounds with high polarity from highly complex matrices.
2.4 Peptides and Proteins in Wines: What Can Be Learnt by Capillary Electrophoresis?
Many macromolecules and proteins in particular tend to adsorb to the inner capillary surface of the capillary due to electrostatic and hydrophobic interactions . Adsorption leads to analytical problems (zone broadening, non-reproducible migration times, errors in quantification …). Two different approaches are offered to the analyst. The first consists in changing the chemistry of the electrolyte by changing its pH or its ionic strength or by adding specific additives. The second strategy involves a modified coating of the fused silica surface that in some cases appeared to be the most suitable strategy for the analysis of such biomolecules [32].
Analyses of variations in the concentrations of biomolecules (proteins, peptides, natural products) that occur either naturally or in response to environmental or genetic influences can provide important insights into complex biological processes. Wine is a complex system requiring a separation step before quantification of variations in the individual components. Several isolation methods have been tested: ultrafiltration, dialysis, and centrifugation [9, 27]. Centrifugation filter devices appeared to be the most convenient for isolate and concentrate wine proteins [9].
For wine samples, the large number of different proteins present and the small concentrations at which they can exist make such experiments difficult. SDS-PAGE has proven to be a powerful tool for the profiling of protein expression [33]. Combining isoelectric focusing for charge-based separation to SDS-PAGE for size-based separation enabled to have hundreds of separated proteic components [34]. Improvements could be achieved by using capillary electrophoresis, which offers many advantages for the separation of a wide variety of molecules.
The first parameter, which conditions the proteinaceous pool of wine, has been shown to be the grape variety from which the wine has been elaborated. Very little difference was noted for wines coming from the same grape variety. However, the protein profiles differ slightly from a cooler growing region compared to a warmer one. The cooler one displayed fewer and smaller protein peaks [9, 27]. However, enological practices occurring during winemaking appeared to have little impact on the protein content. Skin contact, for instance, has been proven to increase the protein concentration without changing the profile of wine.
Capillary electrophoresis enabled to determine that the pool of high-molecular-weight proteins were more specifically involved in haze formation mechanism in white wines [27].
3 Materials and Equipment
3.1 Wine Polyphenol Quantification [14]
-
1.
Analytes: Tyrosol, cis-resveratrol, trans-resveratrol, catechin, epicatechin, hydroxytyrosol, sinapic acid , epicatechin gallate, syringic acid, o-coumaric acid, p-coumaric acid, vanillic acid, gentisic acid, p-hydroxybenzoic acid, salicylic acid, caffeic acid, gallic acid, protocatechuic acid.
-
2.
Sample: White wines (grape variety: Chardonnay, Riesling and Cabernet Blanc, Greco di Tufo, Pinot Grigio, Verdicchio, vintages: 2007 and 2008) from Argentina, Brazil, and Italy; rosé wine from Italia (vintage 2008); red wines (grape variety: Pinot, Cabernet Sauvignon, Barbera, Montepulciano, vintages: 2006 and 2008) from Brazil, Chile, Portugal, and Italy
-
3.
Sample preparation: A liquid/liquid extraction with diethyl ether was carried twice in the dark and under nitrogen atmosphere. The diethyl extract was dried and resuspended in the electrophoretic buffer with 10 % of methanol.
-
4.
CE instrument and capillary: Beckman P/ACE Station 5000 Software equipped with a Diode Array Detector. Uncoated fused silica capillary tube of 75 μm with effective and total lengths of 50 and 57 cm, respectively.
-
5.
CE buffer: The buffer was obtained by mixing H3BO3 (100 mmol/L) and Na2HPO4 (100 mmol/L) and NaOH (2 mol/L) to reach the final composition of phosphate 25 mmol/L, borate 10 mmol/L, and a fixed pH of 8.8.
3.2 Analysis of Wine Proteins and Polypeptides [9]
-
1.
Analytes: Standard proteins from 14.2 to 205 kDa are used as molecular weight markers: α-lactalbumin (14.2 kDa), carbonic anhydrase (29 kDa), ovalbumin (45 kDa), bovine serum albumin (66 kDa), phosphorylase b (97.4 kDa), β-galactosidase (116 kDa), mysosin (205 kDa).
-
2.
Sample: White wine from Tenerife island and red wines from Tenerife, Lanzarote, and Gran Canaria islands. Grape varieties used to produce these wines are Listan, Negro, and Negramoll.
-
3.
Sample preparation: The wine is pre-concentrated by using centrifugal filter devices with a centrifugation for 30 min at 13,000 × g and a molecular weight membrane cutoff of 10 kDa. The retentate is transferred to an Eppendorf vial after a new centrifugation for 3 min at 1000 × g. The retentate is dissolved in the electrophoretic buffer by adding Orange G Reference Marker and 2-mercaptoethanol. The final solution is stirred and heated at 100 °C for 10 min in a closed microfuge vial, prior to cooling for 3 min and filtering with a 0.22 μm filter.
-
4.
CE instrument and capillary: Beckman P/ACE Station 5510 Software equipped with a Diode Array Detector. Coated fused silica capillary tube of 100 μm with effective and total lengths of 40 cm and 47 cm, respectively.
-
5.
CE buffer: Tris/HCl/sodium dodecyl sulfate 1 %, at pH 6.6.
4 Methods
4.1 Wine Polyphenol Analysis
-
1.
The capillary is pre-rinsed with ultrapure water for 1.5 min and electrophoretic buffer for 1.5 min. Before each measuring, the capillary is rinsed with a solution of HCl (0.1 mol/L) for 1.5 min, NaOH (0.1 mol/L) for 1.5 min, and ultrapure water for 1.5 min.
-
2.
Inject the sample hydrodynamically for 7 s with 3.45 kPa.
-
3.
Run sample under 15 kV with running buffer and detect peaks at the specific wavelength corresponding to the maximum of absorption of each wine analytes, in order to improve sensitivity.
-
4.
Figure 1 shows an electropherogram for a diethyl ether extract white wine.
Fig. 1 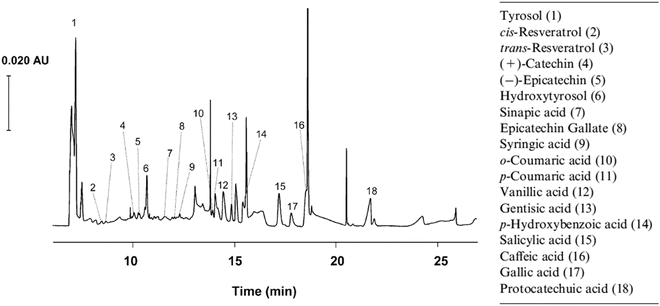
Electropherogram of a white wine diethyl ether extract, with its 18 identified polyphenols . Conditions: uncoated fused silica capillary of 57 cm total length (500 cm of effective length) with 75 μm of inner diameter. The electrophoretic buffer is a mixture of phosphate 25 mmol/L and borate 10 mmol/L, at pH 8.8. UV detection . Injection for 7 s at a pressure of 3.45 kPa. Figure adapted from [14]
-
5.
Calibration is used for the determination of the analyte concentration from integrated peak area. Concentrations of calibrated samples spanned from 1 to 50 mg/L.

4.2 Wine Protein Analysis
-
1.
The new capillary is pre-conditioned with HCl (1 mol/L) for 10 min. The capillary is daily conditioned with HCl (1 mol/L) for 5 min and electrophoretic buffer for 10 min. After each injection, the capillary is rinsed with a solution of HCl (0.1 mol/L) for 1 min and the electrophoretic buffer for 5 min. At the end of each day, the capillary is rinsed with water for 5 min, HCl (0.1 mol/L) for 5 min, and the buffer for 5 min.
-
2.
Inject the sample hydrodynamically for 40 s with 0.5 psi at the cathode.
-
3.
Run sample under −14.1 kV with running buffer and detect peaks at 214 nm.
-
4.
Figure 2 shows sucha a protein profiling of three red wines from Lanzarote, Gran Canaria, and Tenerife islands.
Fig. 2 
Protein profiling of three red wines from Lanzarote, Gran Canaria, and Tenerife islands after a concentration step using centrifugal filter devices. Conditions: Coated capillary of 47 cm total length (40 cm of effective length) with 100 μm of inner diameter. The electrophoretic buffer is a mixture of Tris/HCl/sodium dodecyl sulfate 1 %, at pH 6.6. Detection at 214 nm. Injection for 40 s using N2 pressure (0.5 psi). Standard protein migration times are ranging from 15.2 min (corresponding to 14.2 kDa) to 27. 5 min (corresponding to 205 kDa). Figure adapted from [9]
-
5.
Standard proteins are treated with sodium dodecyl sulfate and 2-mercaptoethanol like the wine proteins and injected at the beginning of each running day. Orange G is added to all injected samples as marker in order to calculate the relative migration time t M (protein migration time/Orange G migration time). The molecular weights (MW) of unknown wine proteins are calculated from the linear regression equation of log MW = 1/t M.

References
Jorgenson JW, Lukacs KD (1981) Zone electrophoresis in open-tubular glass capillaries. Anal Chem 53:1298–1302
VanOrman BB, Liversidge GG, McIntire GL, Olefirowicz TM, Ewing AG (1990) Effects of buffer composition on electroosmotic flow in capillary electrophoresis. J Microcolumn Sep 2:176–180
Gu X, Creasy L, Kester A, Zeece M (1999) Capillary electrophoretic determination of resveratrol in wines. J Agric Food Chem 47:3223–3227
Noe CR, Lachmann B, Möllenbeck S, Richter P (1999) Determination of reducing sugars in selected beverages by capillary electrophoresis. Z Lebensm Unters Forsch 208:148–152
Huang X, Luckey JA, Gordon MJ, Zare RN (1989) Quantitative determination of low molecular weight carboxylic acids by capillary zone electrophoresis/conductivity detection. Anal Chem 61:766–770
Collins TS, Miller CA, Altria KD, Waterhouse AL (1997) Development of a rapid method for the analysis of ethanol in wines using capillary electrophoresis. Am J Enol Vitic 48:280–284
Nouadje G, Siméon N, Dedieu F, Nertz M, Puig P, Couderc F (1997) Determination of twenty eight biogenic amines and amino acids during wine aging by micellar electrokinetic chromatography and laser-induced fluorescence detection. J Chromatogr A 765:337–343
Kovács Á, Simon-Sarkadi L, Ganzler K (1999) Determination of biogenic amines by capillary electrophoresis. J Chromatogr A 836:305–313
Rodríguez-Delgado M, Malovaná S, Montelongo F, Cifuentes A (2002) Fast analysis of proteins in wines by capillary gel electrophoresis. Eur Food Res Technol 214:536–540
Hsieh M-C, Lin C-H (2004) On-line identification of trans-resveratrol in red wine using a sweeping technique combined with capillary electrophoresis/77 K fluorescence spectroscopy. Electrophoresis 25:677–682
de Valme García Moreno M, Castro Mejías R, Natera Marín R, García Barroso C (2002) Analysis of sugar acids by capillary electrophoresis with indirect UV detection. Application to samples of must and wine. Eur Food Res Technol 215:255–259
Peres RG, Moraes EP, Micke GA, Tonin FG, Tavares MFM, Rodriguez-Amaya DB (2009) Rapid method for the determination of organic acids in wine by capillary electrophoresis with indirect UV detection. Food Control 20:548–552
Qin W, Wei H, Li SFY (2003) 1,3-Dialkylimidazolium-based room-temperature ionic liquids as background electrolyte and coating material in aqueous capillary electrophoresis. J Chromatogr A 985:447–454
Minussi RC, Rossi M, Bologna L, Cordi LV, Rotilio D, Pastore GM, Durán N (2003) Phenolic compounds and total antioxidant potential of commercial wines. Food Chem 82:409–416
Lavigne V, Pons A, Dubourdieu D (2007) Assay of glutathione in must and wines using capillary electrophoresis and laser-induced fluorescence detection: changes in concentration in dry white wines during alcoholic fermentation and aging. J Chromatogr A 1139:130–135
Vanhoenacker G, De Villiers A, Lazou K, De Keukeleire D, Sandra P (2001) Comparison of high-performance liquid chromatography—mass spectroscopy and capillary electrophoresis—mass spectroscopy for the analysis of phenolic compounds in diethyl ether extracts of red wines. Chromatographia 54:309–315
Simó C, Moreno-Arribas MV, Cifuentes A (2008) Ion-trap versus time-of-flight mass spectrometry coupled to capillary electrophoresis to analyze biogenic amines in wine. J Chromatogr A 1195:150–156
Santos B, Simonet BM, Ríos A, Valcárcel M (2004) Direct automatic determination of biogenic amines in wine by flow injection-capillary electrophoresis-mass spectrometry. Electrophoresis 25:3427–3433
Simó C, Elvira C, González N, San Román J, Barbas C, Cifuentes A (2004) Capillary electrophoresis-mass spectrometry of basic proteins using a new physically adsorbed polymer coating. Some applications in food analysis. Electrophoresis 25:2056–2064
Zhao SS, Zhong X, Tie C, Chen DD (2012) Capillary electrophoresis-mass spectrometry for analysis of complex samples. Proteomics 12:2991–3012
Wang S-P, Huang K-J (2004) Determination of flavonoids by high-performance liquid chromatography and capillary electrophoresis. J Chromatogr A 1032:273–279
Gu X, Chu Q, O’Dwyer M, Zeece M (2000) Analysis of resveratrol in wine by capillary electrophoresis. J Chromatogr A 881:471–481
Brandolini V, Maietti A, Tedeschi P, Durini E, Vertuani S, Manfredini S (2002) Capillary electrophoresis determination, synthesis, and stability of resveratrol and related 3-O-β-d-glucopyranosides. J Agric Food Chem 50:7407–7411
Panossian A, Mamikonyan G, Torosyan M, Gabrielyan E, Mkhitaryan S (2001) Analysis of aromatic aldehydes in brandy and wine by high-performance capillary electrophoresis. Anal Chem 73:4379–4383
Luguera C, Moreno-Arribas V, Pueyo E, Polo MC (1997) Capillary electrophoretic analysis of wine proteins. Modifications during the manufacture of sparkling wines. J Agric Food Chem 45:3766–3770
Luguera C, Moreno-Arribas V, Pueyo E, Bartolome B, Polo MC (1998) Fractionation and partial characterization of protein fractions present at different stages of the production of sparkling wines. Food Chem 63:465–471
Dizy M, Bisson LF (1999) White wine protein analysis by capillary zone electrophoresis. Am J Enol Vitic 50:120–127
Waterhouse AL (2002) Wine phenolics. Ann N Y Acad Sci 957:21–36
Herrero-Martínez JM, Sanmartin M, Rosés M, Bosch E, Ràfols C (2005) Determination of dissociation constants of flavonoids by capillary electrophoresis. Electrophoresis 26:1886–1895
Roullier-Gall C, Boutegrabet L, Gougeon RD, Schmitt-Kopplin P (2014) A grape and wine chemodiversity comparison of different appellations in Burgundy: vintage vs terroir effects. Food Chem 152:100–107
He Y, Harir M, Chen G, Gougeon RD, Zhang L, Huang X, Schmitt-Kopplin P (2014) Capillary electrokinetic fractionation mass spectrometry (CEkF/MS): technology setup and application to metabolite fractionation from complex samples coupled at-line with ultrahigh-resolution mass spectrometry. Electrophoresis 35:1965–1975
Schmalzing D, Piggee CA, Foret F, Carrilho E, Karger BL (1993) Characterization and performance of a neutral hydrophilic coating for the capillary electrophoretic separation of biopolymers. J Chromatogr A 652:149–159
Dorrestein E, Ferreira RB, Laureano O, Teixeira AR (1995) Electrophoretic and FPLC analysis of soluble proteins in four portuguese wines. Am J Enol Vitic 46:235–242
Cilindre C, Jégou S, Hovasse A, Schaeffer C, Castro AJ, Clément C, Van Dorsselaer A, Jeandet P, Marchal R (2008) Proteomic approach to identify champagne wine proteins as modified by Botrytis cinerea infection. J Proteome Res 7:1199–1208
Cataldi TRI, Nardiello D, Scrano L, Scopa A (2002) Assay of riboflavin in sample wines by capillary zone electrophoresis and laser-induced fluorescence detection. J Agric Food Chem 50:6643–6647
Cataldi TRI, Nardiello D, De Benedetto GE, Bufo SA (2002) Optimizing separation conditions for riboflavin, flavin mononucleotide and flavin adenine dinucleotide in capillary zone electrophoresis with laser-induced fluorescence detection. J Chromatogr A 968:229–239
Saavedra L, Barbas C (2003) Validated capillary electrophoresis method for small-anions measurement in wines. Electrophoresis 24:2235–2243
Author information
Authors and Affiliations
Corresponding author
Editor information
Editors and Affiliations
Rights and permissions
Copyright information
© 2016 Springer Science+Business Media New York
About this protocol
Cite this protocol
Coelho, C., Bagala, F., Gougeon, R.D., Schmitt-Kopplin, P. (2016). Capillary Electrophoresis in Wine Science. In: Schmitt-Kopplin, P. (eds) Capillary Electrophoresis. Methods in Molecular Biology, vol 1483. Humana Press, New York, NY. https://doi.org/10.1007/978-1-4939-6403-1_23
Download citation
DOI: https://doi.org/10.1007/978-1-4939-6403-1_23
Published:
Publisher Name: Humana Press, New York, NY
Print ISBN: 978-1-4939-6401-7
Online ISBN: 978-1-4939-6403-1
eBook Packages: Springer Protocols