
Abstract
Intercellular communication occurring via gap junction channels is considered a key mechanism for synchronizing physiological functions of cells and for the maintenance of tissue homeostasis. Gap junction channels are protein channels that are situated between neighboring cells and that provide a direct, yet selective route for the passage of small hydrophilic biomolecules and ions. Here, an electroporation method is described to load a localized area within an adherent cell monolayer with a gap junction-permeable fluorescent reporter dye. The technique results in a rapid and efficient labeling of a small patch of cells within the cell culture, without affecting cellular viability. Dynamic and quantitative information on gap junctional communication can subsequently be extracted by tracing the intercellular movement of the dye via time-lapse microscopy.
Access provided by CONRICYT – Journals CONACYT. Download protocol PDF
Key words
1 Introduction
In a multicellular organism, cells do not function on their own, but they highly interact with each other to provide a coordinated response to certain intracellular and extracellular conditions [1]. The interaction can exist of merely adhesive capacity, but it can also mediate the actual exchange of signaling molecules between neighboring cells via specialized contacts consisting of vast arrays of plasma membrane channels, called gap junction channels (GJCs) (Fig. 1) [2, 3]. These channels connect the cytoplasm of adjacent cells and arise from the head-to-head interaction of two hemichannels, being hexamers composed of connexin (Cx) subunits. The latter are tetraspan membrane proteins of which 21 human species have been identified and named according to their molecular weight (MW). They are present in most organs and display a tissue and cellular specificity with Cx43 being the most abundant and widespread Cx in mammals [4, 5].

Schematic diagram of gap junctions and their subunits. A set of 6 Cx proteins arrange themselves into a hemichannel configuration after which they are inserted in the cellular membrane. Two hemichannels that are located at a cell–cell contact region align to form a GJC. Multiple GJCs concentrate at so-called gap junction plaques, where they allow the bidirectional diffusion-driven transport of ions and small hydrophilic molecules (i.e., <1.5 kDa) between neighboring cells. This process, denoted by gap junctional intercellular communication , allows for a coordinated response of cells to certain stimuli and is a prerequisite for normal tissue homeostasis
Most cells of normal tissue, except for differentiated skeletal muscle cells, and freely circulating cells including erythrocytes and circulating lymphocytes, communicate through GJCs [6]. Gap junctional intercellular communication (GJIC) is driven by the passive diffusion of small (i.e., <1–1.5 kDa) hydrophilic molecules, such as glucose, glutamate, glutathione, cyclic adenosine monophosphate, adenosine 5′-triphosphate, inositol 1,4,5-trisphosphate, and ions, including Ca2+, K+, Na+, and Cl-. Although GJCs appear to be a rather general route for the exchange of these molecules as well as other substances such as fluorescent dyes, their biophysical permeation properties actually depend on the nature of the Cx species that form the channel [7–12]. There is furthermore a tremendous diversity in the assembly of GJCs, as they can be composed of either homogeneous or heterogeneous subunits resulting in variations in pore sizes [3]. Not only the size, but also the charge of the permeating molecule as well as the presence of high affinity binding sites for specific transjunctional metabolites within the channel pore are suggested to underlie these differences in permselectivity [13–15]. The Cx-subtype furthermore dictates the specific regulatory properties of these channels, such as by membrane voltage, the intracellular environment (i.e., cytoplasmic Ca2+ and pH), interaction with proteins, posttranslational modifications , and pharmacological agents [3, 16].
Several methods are currently available for investigating GJIC, all with their advantages and limitations [1, 17, 18]. The most simple, widely applicable, and also best-known approach consists of the introduction of a small dye into living cells and microscopically tracking its intercellular diffusion to neighboring cells. Several hydrophilic molecules covering a broad range of sizes (i.e., below 1 kDa) and charges can be used [8, 12]. In order to visualize subsequent dye spread in function of time, the reporter dye should fulfill several characteristics, namely: (1) it should be visible by transmitted light or fluorescence microscopy, (2) the fluorescence intensity should remain stable during recording, (3) the dye has to be GJC permeable, but also plasma membrane impermeable in order to avoid transfer through the extracellular space, (4) the choice of a specific GJC reporter dye should reflect the Cx under study as outlined earlier, (5) the dye should be able to freely diffuse throughout the cytoplasm, and (6) it cannot be toxic to the cells or change intracellular properties of the cells that can influence GJIC, such as modifying the intracellular Ca2+ concentration or pH. Frequently used fluorescent dyes for evaluating GJIC are Lucifer Yellow (MW 457 Da, charge -2), 6-carboxyfluorescein (6-CF; MW 376 Da, charge -2), calcein (MW 623 Da, -4), or Alexa Fluor dyes (available in the 350–760 Da MW range). Small nonfluorescent molecules, such as neurobiotin, are also frequently applied as tracers to probe GJIC. However, time-lapse imaging of dye transfer of these molecules is not possible, since the samples have to undergo additional fixation and staining procedures to visualize them. Of note, although channels composed of different Cx species display distinct permeability characteristics, most Cx channels are permeable to several tracers . Unfortunately, there are currently no dyes available that are specific for a channel composed of certain Cx subunits.
In principle, dye introduction can be achieved by several approaches, for example, by impaling cells with sharp pipettes for microinjection or by making a scrape in a cell monolayer using a blade or needle [19, 20]. However, these methods do not only damage cells but also modify or even washout certain intracellular components that are required for normal physiological signaling. Ideally, the loading technique should be minimally invasive and able to provide dynamic and quantitative information of dye transfer. Here, an electroporation technique is described that grants the loading of a spatially restricted area within an adherent cell population in vitro with a fluorescent GJC-permeable reporter dye . Subsequent time-lapse monitoring of dye diffusion throughout the cell population allows for the visualization of cells that are connected to each other through GJCs, a technique further denoted by electroporation loading and dye transfer (ELDT). Electroporation designates the application of high voltage pulses to create transient nanometer-scale pores into the plasma membrane via which extracellularly applied plasma membrane-impermeable molecules, such as nucleic acids, drugs, antibodies, proteins/peptides, radiotracers , and reporter dyes , can enter the cell [21–25]. Pore formation happens on a time scale of microseconds while closure occurs within seconds. By comparing electroporation with other dye loading techniques, such as microinjection and scrape loading , we conclude that it offers at least 4 advantages: (1) when optimized, it is a safe and superior method to evaluate GJIC as it is does not negatively affect the cellular physiology and viability [26–28]. The latter can have adverse effects on GJIC, e.g. via a perturbation of the cellular Ca2+ homeostasis. (2) It is a highly versatile technique that allows the labeling of small or large areas within a cell culture with virtually any compound with responses subsequently being monitored in adjacent nonloaded areas. We have successfully applied the technique for the loading of fluorescent dyes, caged compounds, molecules/peptides interfering with signaling pathways, and even recombinantly expressed and purified enzymes, and this in the context of Ca2+ signaling and cell death studies, and for measuring GJIC as outlined later [26, 28–38]. (3) The technique is not restricted to specific cell types [26, 28–39]. (4) Only minimal quantities of the electroporated compound are required for an efficient loading as outlined in the protocol later.
The loading method necessitates an electrical drive circuit providing an electroporation signal and an electrode to apply the signal to a localized zone in a cell monolayer [26, 40]. Ideally, the electroporation protocol should combine a good loading efficiency, while having only a minimal impact on cell viability in order to allow subsequent functional studies. Both the loading efficiency and the cell viability primarily depend on the applied electric pulse parameters [26, 41, 42]. The latter can be controlled in such a way that the pores have sufficient large radii to allow the entrance of extracellular molecules to the cells’ interior and reclose rapidly without causing a disturbance in cellular physiology. We recently optimized an electroporation protocol to load a narrow strip of adherent cells with a GJC-permeable fluorescent reporter dye . We demonstrated that the application of a high-frequency (i.e., 50 kHz) electrical signal oscillating around the zero potential as a bipolar alternating current (AC) is preferred over a high amplitude direct current (DC) protocol to load the cells with the dye and to evaluate subsequent dye spread [26]. The main reason is that the absence of a DC component in the electrical drive signal preserves cell viability. The AC-coupled stimulation can be practically achieved by using an amplifier with a transformer to isolate the output of the signal-generating device [26, 27]. The 50 kHz voltage oscillations are applied in a pulsed and repeated manner with the oscillatory signal being switched-on ten times per s for 2 ms, forming a pulse train that is repeated 15 times with 0.5 s pauses (Fig. 2a).

Overview of the electroporation setup used for the generation and registration of bipolar pulses. (a) The computer generates a TTL pulse that serves as input for the electroporation driver circuit and as a trigger for the oscilloscope. The TTL pulse is converted by the electroporation driver circuit to a 50 kHz oscillating signal that alternates between positive and negative voltages, and that is sent to the electrode and is monitored by the oscilloscope. This oscillating signal is applied in 15 series of 1 s duration, each consisting of 10 repetitions of 2 ms duration. A schematic overview of the driver circuit has been published previously [26, 27] and a detailed diagram of the generator and amplifier setup is also available on request. (b) Picture of the microscope stage and the electrode. Note the two parallel Pt/Ir wires that are protruding out of the tip of the theta glass capillary. The exposed ends are about 300 μm in length (i.e., higher magnification in Fig. 2c). During the experimental procedure, the electrode is positioned above the cells using the micromanipulator. (c) Phase contrast/fluorescence overlay images taken before (i.e., without (a) and with (b) the electrode positioned on top of the cells) and directly after electroporation loading (i.e., after removal of the remaining extracellular dye solution) (c–d). Cell morphology and viability are well preserved after electroporation . Note that in (b) and (c) the electrode is positioned 100 μm above the cell layer. The objective is positioned in the focal plane of the electrode and 100 μm higher relative to the focal plane of the cell layer. The scale bar measures 100 μm
Loading of a restricted area can be achieved by applying the bipolar voltage pulses to a 2-wire electrode that is positioned in close proximity to the target cells. The area of electroporated cells depends on the electrode dimensions. In previous studies, we used an electrode consisting of 2 parallel Pt/Ir wires with a diameter of 120 μm, 8 mm long and separated by 500 μm. When placed about 400 μm above the cells and applying a peak-to-peak oscillation voltage of 100 V, this results in a longitudinal electroporated zone of about 300 μm wide and 8 mm long (i.e., surface area about 2.4 mm2) [26–28, 34]. The actual size of the electrode can be modified according to specific needs. In a first section of this chapter, we describe the assembly of a 2-wire fork-shaped electrode instead of the previously strip-shaped, using 50 μm diameter Pt/Ir wire which results in the electroporation of a smaller patch of cells with an average surface area of about 0.07 mm2 (Fig. 2b, c). In a second section, a detailed procedure for the time-lapse microscopy imaging as well as the analysis of dye spread to neighboring nonloaded cells is provided.
2 Materials
2.1 Assembly of a Parallel 2-Wire Fork-Shaped Pt/Ir Electrode
-
1.
Borosilicate theta capillary glass (OD/ID 2/1.4 mm, length 10 cm; Harvard apparatus, USA).
-
2.
Pt/Ir wire 90:10, diameter 50 μm (Advent Research Materials Ltd, England).
-
3.
Microelectrode puller (Model P-97, Sutter Instrument, USA).
-
4.
Micromanipulator (PatchMan NP2, Eppendorf, Belgium).
2.2 Electroporation Loading and Time-Lapse Imaging of Dye Transfer
-
1.
Adherent confluent monolayer culture (see Note 1 ) seeded on polystyrene dishes or glass bottom dishes (CELLviewTM Dish, Greiner Bio One, Belgium).
-
2.
Electroporation buffer: 300 mM sorbitol, 4.02 mM KH2PO4, 10.8 mM K2HPO4, 1.0 mM MgCl2, and 2.0 mM 4-(2-hydroxyethyl)-1-piperazineethanesulfonic acid (HEPES). Adjust to pH 7 and store at 4–8 °C.
-
3.
Electroporation solution: 1 mM 6-CF (Life Technologies, Belgium) and 1 mM 10 kDa Dextran Rhodamine (DR) (Life Technologies, Belgium) in electroporation buffer (see Notes 2 – 4 ). Aliquots can be stored at −20 °C and should be thawed in the absence of light. Repetitive thawing should be avoided. The solution should be at room temperature prior to use.
-
4.
Hanks Balanced Salt Solution (HBSS-HEPES): 0.81 mM MgSO4⋅7H2O, 0.95 mM CaCl2⋅2H2O, 137 mM NaCl, 0.18 mM Na2HPO4⋅2H2O, 5.36 mM KCl, 0.44 mM KH2PO4, 5.55 mM d-glucose, and 25 mM HEPES. Adjust to pH 7.4 and store at 4–8 °C.
-
5.
10 μL microloader pipette tips.
-
6.
Electroporation driver circuit (see Note 5 ).
-
7.
Oscilloscope for inspection of peak-to-peak electroporation voltage (ISO-TECH IDS 6072A-U, RS Components, Belgium).
-
8.
Computer to generate Transistor–Transistor Logic (TTL) pulses.
-
9.
Nikon Eclipse TE300 inverted epifluorescence microscope (Nikon Belux, Belgium) positioned on an antivibration table and supplied with an EM-CCD camera (QuantEM™ 512SC CCD camera, Photometrics, USA), a Lambda DG-4 filterswitch (Sutter Instrument Company, Novato, Canada), a multiband dichroic mirror and emitter filter set (XF2050 and XF3063, respectively, Omega Optical, USA), and a 10× objective (Plan APO, NA 0.45—Nikon). The microscopic stage is equally equipped with the electroporation electrode mounted on a micromanipulator and suction and perfusion tubes, positioned in 3-axis course manipulators and connected, respectively, to a suction device and perfusion system (Fig. 2b) (see Note 6 ).
-
10.
Quantem Frames imaging software (custom developed in Microsoft Visual C++ 6.0).
2.3 Analysis of Dye Spread
FluoFrames analysis software (custom developed in Microsoft Visual C++ 6.0) (see Note 7 ).
3 Methods
3.1 Assembly of a Parallel 2-Wire Fork-Shaped Electrode
Parallel bipolar microelectrodes are commercially available, e.g. at FHC (Canada). Alternatively, the electrode can be fabricated according to the procedure described as follows.
-
1.
Pull glass pipettes and break the tip to obtain a tip size of approximately 150 μm outer diameter (Fig. 2b).
-
2.
Insert a 5 cm long Pt/Ir wire into each lumen of the theta glass pipette (see Note 8 ). Using a blade, shorten the protruding wires at the tip of the pipette under microscopy observation such that the exposed ends are about 300 μm in length (Fig. 2c).
-
3.
Fix the wires into the glass pipette by applying a small amount of cyanoacrylate glue to the tip of the capillary to seal around each wire.
-
4.
Solder each Pt/Ir wire at the other end to an electric wire for connection to the driver box.
-
5.
Attach the pipette to a rod for subsequent mounting on a micromanipulator and connection to the driver circuit.
3.2 Electroporation Loading and Time-Lapse Imaging of Dye Transfer
-
1.
Preheat the HBSS-HEPES and the low-conductivity electroporation buffer to 37 °C to avoid a sudden temperature drop upon medium change.
-
2.
Prepare the electroporation buffer solution containing the desired compounds.
-
3.
Remove the cell culture dish from the incubator and place it on the stage of the microscope.
-
4.
Rinse the cells three times with HBSS-HEPES, followed by two times with the low-conductivity electroporation buffer solution (see Note 9 ) using the suction/perfusion system.
-
5.
Completely remove the electroporation buffer solution (see Note 10 ).
-
6.
Visualize and focus to the cells using transmitted light microscopy and subsequently move the objective 100 μm higher relative to the focal plane of the cell layer via the calibrated micrometer dial on the focus knob.
-
7.
Under transmitted light microscopy observation and using the micromanipulator, guide the electrode toward the area of interest until the wires are in perfect focus at the edges.
-
8.
Administer 10 μL of the electroporation solution at the tip of the electrode with a microloader tip and apply the AC-coupled electroporation drive signal to the electrode (see Note 11 ).
-
9.
Rinse the cells with HBSS-HEPES using the suction/perfusion system.
-
10.
Start imaging. Images are recorded at room temperature and in the absence of light at a 5 min time interval, and this for a 25 min period post-electroporation . The cells are kept in HBSS-HEPES during the whole imaging period. Simultaneous imaging of 6-CF and 10 kDa DR is carried out by exciting the dyes using 482 and 568 nm light, respectively, that is obtained from a Xenon light source and a Lambda DG-4 filterswitch. Emission passes through a multiband dichroic mirror and emitter filter set.
3.3 Quantification of Dye Spread
Intercellular dye spread can be quantified by counting the number of cells that received the GJC-permeable dye from the initially loaded cells. An alternative approach consists of calculating the surface area of dye spread and the half-maximal dye transfer index as outlined as follows.
-
1.
Apply a threshold to all images. The threshold is derived from the histogram of the pixel intensity distribution of the image taken immediately after electroporation (0′ time point in Figs. 3 and 4) and corresponds to the upper level of the background noise. The latter typically generates a large peak at lower intensity values. We set the threshold at the right flank of the peak at half-maximal pixel intensity.
Fig. 3 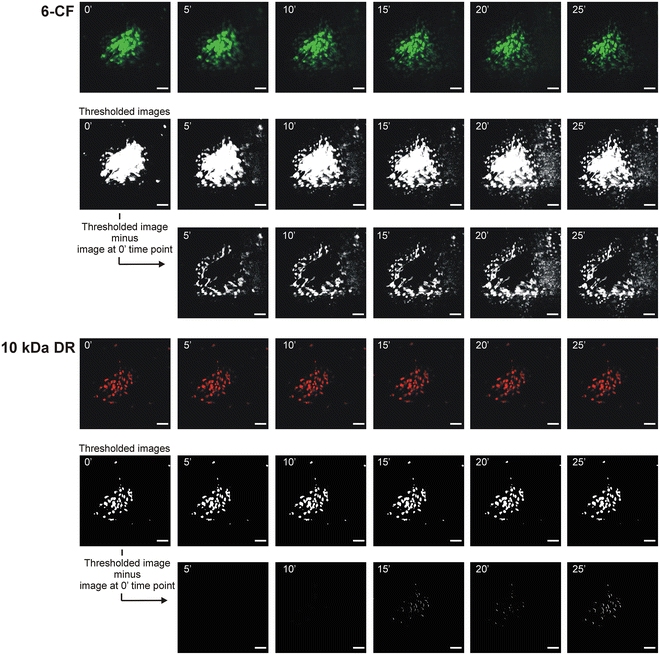
Dye transfer experiment in C6 glioma cells stably transfected with Cx43. C6 glioma cells were electroporated with a solution containing the GJC-permeable 6-CF and the high molecular weight dye 10 kDa DR. Images were taken at several time points after electroporation , were thresholded, and were subsequently subtracted by the image taken immediately after electroporation (i.e., 0′ time point). The resulting image displays the dye transfer area that contains cells (in white) that received dye from the electroporated area. Quantitative information is presented in Fig. 4. The scale bar measures 100 μm
Fig. 4 
Dye transfer experiment in C6 glioma cells stably transfected with Cx43 in the presence of the Cx channel blocker carbenoxolone (Cbx). Similar experiment as in Fig. 3, but now 25 μM Cbx was added to the supernatant 15 min before electroporation and also during the 25 min imaging period. The graph represents the dye transfer area in function of time after electroporation. In the absence of Cbx, the surface area of the 6-CF dye expanded over time, whereas the 10 kDa DR did not spread to neighboring cells, but remained locally in the electroporated area. The presence of Cbx strongly decreased the spread of 6-CF to neighboring cells. The half-maximal dye transfer rate index (i.e., the ratio of the half-maximal surface area to the corresponding time) for 6-CF can be derived from the graph (black dot) and is equal to 59.5 μm2 per s. The scale bar measures 100 μm
-
2.
Subtract the first image, recorded immediately after electroporation (0′ time point in Figs. 3 and 4) on a pixel-to-pixel basis from all subsequent images.
-
3.
Calculate the area of above threshold pixels and convert to a μm2 scale. The surface area can be represented as a function of time from which the half-maximal dye transfer rate index can be determined (Figs. 3 and 4).


4 Notes
-
1.
We have used the electroporation method to load various substances in different cell types including C6 glioma cells, endothelial cell lines (RBE4 and bEND.3), epithelial cell lines (MDCK, ECV304 and HeLa cells), fibroblast cell lines (MEF and HEK), and primary cortical astrocytes [26, 28–39].
-
2.
Figures 3 and 4 demonstrate the transfer of the GJC-permeable dye 6-CF through GJCs composed of Cx43 in a C6 glioma culture stably transfected with Cx43 in the absence or presence of the Cx channel blocker carbenoxolone (Cbx). However, as outlined, the permeability of GJCs for specific dyes is related to the Cx subunit composition. The choice of the GJC reporter dye thus depends on the Cx under study.
-
3.
A second high MW dye can be co-electroporated to test for dye transfer not mediated by GJCs. Obviously, the excitation/emission of this reporter dye may not coincide with the excitation/emission spectrum of the GJIC indicator. Commonly applied GJ-impermeable fluorescent reporter markers include 10 kDa DR or 10 kDa FITC-dextran.
-
4.
Caution should be taken when loading agents that are dissolved in DMSO concentrations above 0.2 %. Although it has been described that DMSO (i.e., 1.25 %) stabilizes the plasma membrane during electroporation loading and improves loading efficiency [43, 44], it might affect GJIC [45]. It is also recommended to filter the electroporation solution in order to remove any particulates.
-
5.
The device to generate a 50 kHz AC-coupled pulsed electroporation signal is nonstandard equipment and is not commercially available. A schematic overview of the driver circuit has been published previously [26, 27] and a detailed diagram of the generator and amplifier setup is also available on request.
-
6.
In order to perform time-lapse imaging of the gap junctional dye spread, it is imperative to have the microscope used for positioning the electrode equipped with a light source and filters to excite the fluorescent dyes as well as a suction/perfusion device to remove residual dye after electroporation . Since the electroporation procedure has to take place in the absence of any vibrations, it is convenient to have the microscope positioned on an antivibration table. Finally, dye transfer to neighboring cells can be observed, provided that the level of illumination is kept low. In order to avoid cellular damage from illumination, it is advised to use a sensitive high-quality CCD camera. Here, imaging is carried out using an electron multiplying QuantEM™ 512SC CCD camera from Photometrics (USA).
-
7.
The analysis can also be performed with Adobe Photoshop software (Adobe Systems, USA) or Image J software (http://imagej.nih.gov/ij/).
-
8.
A theta glass pipette is used to protect and separate the thin wires of the bipolar electrode.
-
9.
This low conductivity buffer is specifically formulated to minimize current flow during the electroporation procedure, thus preventing any significant damage to the cells.
-
10.
From this stage on, the cells only contain some solution that is kept there by capillary forces (i.e., clefts between cells) and attraction by osmotic forces. The next steps (i.e., 6–9) need to be performed as rapidly as possible.
-
11.
The electroporation protocol consists of 15 pulse trains, each containing 10 pulses (i.e., 2 ms in duration) per second of a 50 kHz electrical signal and separated by 0.5 s breaks (Fig. 2a). Important to note is that (1) the concentration that a compound reaches within the cell after electroporation loading is lower to that within the electroporation solution and (2) the loading efficiency decreases with higher MW. A loading efficiency of about 40 % can be obtained with a 50 V peak-to-peak voltage applied to electrode wires separated by 150 μm (i.e., electrical field strength ~3300 V/cm) for molecules with a MW of 0.4–10 kDa [26]. In addition, with these settings, cell death in the electroporated area is not different from spontaneous cell death in nonelectroporated zones of the cell cultures as measured by uptake of the cell impermeable and DNA integrating dye propidium iodide (i.e., 30 μm, 15 min incubation at room temperature) at 5 min postelectroporation (i.e., 0.56 % ±0.15 in the electroporated area versus 0.47 % ±0.21, respectively, in surrounding nonelectroporated cells (n = 3)) [26, 28]. However, a careful and thorough optimization of the electroporation parameters is required for each cell type used as the efficiency and safety (i.e., cell death) of a given field strength and electrode morphology critically depends on the geometry of the cells [46]. Optimization is done by varying the distance of the electrode from the cells and the voltage applied to the electrode until optimal loading efficiency and minimal cell death is achieved. An electrode that is positioned too close to the cells or a too high voltage will result in increased cell death counts. In contrast, an electrode that is positioned too far from the cells or a too low voltage will provide a low loading efficiency and thus less dye in the cell’s interior to be spread to neighboring cells via GJCs. The loading efficiency can be estimated by calculating the ratio of the fluorescence intensity of the reporter dye in the electroporation zone to the fluorescence intensity of a thin layer of the same marker, sandwiched between two glass coverslips. The thickness of this layer should approximate the thickness of the monolayer of the cells used which can be estimated by recording Z-stacks of confocal laser scanning images of cells loaded with a fluorescent indicator dye. We refer the reader to our previous papers [27, 40] for a detailed protocol. Finally, in order to maintain a consistent loading efficiency, it is important to clean the electrode on a frequent basis with deionized water and from time to time with 1 mM NaOH.
References
Wei Q, Huang H (2013) Insights into the role of cell-cell junctions in physiology and disease. Int Rev Cell Mol Biol 306:187–221
Herve JC, Derangeon M (2013) Gap-junction-mediated cell-to-cell communication. Cell Tissue Res 352:21–31
Maeda S, Tsukihara T (2011) Structure of the gap junction channel and its implications for its biological functions. Cell Mol Life Sci 68:1115–1129
Sohl G, Willecke K (2003) An update on connexin genes and their nomenclature in mouse and man. Cell Commun Adhes 10:173–180
Laird DW (2006) Life cycle of connexins in health and disease. Biochem J 394:527–543
Reinecke H, Minami E, Virag JI et al (2004) Gene transfer of connexin43 into skeletal muscle. Hum Gene Ther 15:627–636
Alexander DB, Goldberg GS (2003) Transfer of biologically important molecules between cells through gap junction channels. Curr Med Chem 10:2045–2058
Elfgang C, Eckert R, Lichtenberg-Frate H et al (1995) Specific permeability and selective formation of gap junction channels in connexin-transfected HeLa cells. J Cell Biol 129:805–817
Bukauskas FF, Elfgang C, Willecke K et al (1995) Heterotypic gap junction channels (connexin26-connexin32) violate the paradigm of unitary conductance. Pflugers Arch 429:870–872
Kanaporis G, Mese G, Valiuniene L et al (2008) Gap junction channels exhibit connexin-specific permeability to cyclic nucleotides. J Gen Physiol 131:293–305
Goldberg GS, Moreno AP, Lampe PD (2002) Gap junctions between cells expressing connexin 43 or 32 show inverse permselectivity to adenosine and ATP. J Biol Chem 277:36725–36730
Kanaporis G, Brink PR, Valiunas V (2010) Gap junction permeability: selectivity for anionic and cationic probes. Am J Physiol 300:C600–C609
Veenstra RD (1996) Size and selectivity of gap junction channels formed from different connexins. J Bioenerg Biomembr 28:327–337
Bevans CG, Kordel M, Rhee SK et al (1998) Isoform composition of connexin channels determines selectivity among second messengers and uncharged molecules. J Biol Chem 273:2808–2816
Bevans CG, Harris AL (1999) Direct high affinity modulation of connexin channel activity by cyclic nucleotides. J Biol Chem 274:3720–3725
Verselis VK, Srinivas M (2013) Connexin channel modulators and their mechanisms of action. Neuropharmacology 75:517–524
Abbaci M, Barberi-Heyob M, Blondel W et al (2008) Advantages and limitations of commonly used methods to assay the molecular permeability of gap junctional intercellular communication. Biotechniques 45:33–52
Maes M, Crespo Yanguas S, Willebrords J et al (2016) Models and methods for in vitro testing of hepatic gap junctional communication. Toxicol In Vitro 25:569–577
El-Fouly MH, Trosko JE, Chang CC (1987) Scrape-loading and dye transfer. A rapid and simple technique to study gap junctional intercellular communication. Exp Cell Res 168:422–430
Liu J, Siragam V, Chen J et al (2014) High-throughput measurement of gap junctional intercellular communication. Am J Physiol Heart Circ Physiol 306:H1708–H1713
Gehl J (2003) Electroporation: theory and methods, perspectives for drug delivery, gene therapy and research. Acta Physiol Scand 177:437–447
Teruel MN, Meyer T (1997) Electroporation-induced formation of individual calcium entry sites in the cell body and processes of adherent cells. Biophys J 73:1785–1796
Ho SY, Mittal GS (1996) Electroporation of cell membranes: a review. Crit Rev Biotechnol 16:349–362
Weaver JC (1993) Electroporation: a general phenomenon for manipulating cells and tissues. J Cell Biochem 51:426–435
Kotnik T, Frey W, Sack M et al (2015) Electroporation-based applications in biotechnology. Trends Biotechnol 33:480–488
De Vuyst E, De Bock M, Decrock E et al (2008) In situ bipolar electroporation for localized cell loading with reporter dyes and investigating gap junctional coupling. Biophys J 94:469–479
Decrock E, De Bock M, Wang N et al (2015) Electroporation loading and flash photolysis to investigate intra- and intercellular Ca2+ signaling. Cold Spring Harb Protoc 2015:239–249
Decrock E, De Vuyst E, Vinken M et al (2009) Connexin 43 hemichannels contribute to the propagation of apoptotic cell death in a rat C6 glioma cell model. Cell Death Differ 16:151–163
Braet K, Aspeslagh S, Vandamme W et al (2003) Pharmacological sensitivity of ATP release triggered by photoliberation of inositol-1,4,5-trisphosphate and zero extracellular calcium in brain endothelial cells. J Cell Physiol 197:205–213
Braet K, Mabilde C, Cabooter L et al (2004) Electroporation loading and photoactivation of caged InsP3: tools to investigate the relation between cellular ATP release in response to intracellular InsP3 elevation. J Neurosci Methods 132:81–89
Braet K, Paemeleire K, D'Herde K et al (2001) Astrocyte-endothelial cell calcium signals conveyed by two signalling pathways. Eur J Neurosci 13:79–91
Monaco G, Decrock E, Akl H et al (2012) Selective regulation of IP3-receptor-mediated Ca2+ signaling and apoptosis by the BH4 domain of Bcl-2 versus Bcl-Xl. Cell Death Differ 19:295–309
De Bock M, Wang N, Bol M et al (2012) Connexin-43 hemichannels contribute to cytoplasmic Ca2+ oscillations by providing a bimodal Ca2+-dependent Ca2+-entry pathway. J Biol Chem 287:12250–12266
Decrock E, Krysko DV, Vinken M et al (2012) Transfer of IP3 through gap junctions is critical, but not sufficient, for the spread of apoptosis. Cell Death Differ 19:947–957
Vervliet T, Lemmens I, Vandermarliere E et al (2015) Ryanodine receptors are targeted by anti-apoptotic Bcl-XL involving its BH4 domain and Lys87 from its BH3 domain. Sci Rep 5:9641
Monaco G, Decrock E, Arbel N et al (2015) The BH4 domain of anti-apoptotic Bcl-XL, but not that of the related Bcl-2, limits the voltage-dependent anion channel 1 (VDAC1)-mediated transfer of pro-apoptotic Ca2+ signals to mitochondria. J Biol Chem 290:9150–9161
Vervliet T, Decrock E, Molgo J et al (2014) Bcl-2 binds to and inhibits ryanodine receptors. J Cell Sci 127:2782–2792
Monaco G, Decrock E, Nuyts K et al (2013) Alpha-helical destabilization of the Bcl-2-BH4-domain peptide abolishes its ability to inhibit the IP3 receptor. PLoS One 8:e73386
Leybaert L, Sanderson MJ (2001) Intercellular calcium signaling and flash photolysis of caged compounds: a sensitive method to evaluate gap junctional coupling. Methods Mol Biol 154:407–430
Decrock E, De Bock M, Wang N et al (2015) Electroporation loading of membrane-impermeable molecules to investigate intra- and intercellular Ca2+ signaling. Cold Spring Harb Protoc 2015:284–288
Wegener J, Keese CR, Giaever I (2002) Recovery of adherent cells after in situ electroporation monitored electrically. Biotechniques 33:348, 350, 352 passim
Kotnik T, Pucihar G, Rebersek M et al (2003) Role of pulse shape in cell membrane electropermeabilization. Biochim Biophys Acta 1614:193–200
Fyrberg A, Lotfi K (2010) Optimization and evaluation of electroporation delivery of siRNA in the human leukemic CEM cell line. Cytotechnology 62:497–507
Melkonyan H, Sorg C, Klempt M (1996) Electroporation efficiency in mammalian cells is increased by dimethyl sulfoxide (DMSO). Nucleic Acids Res 24:4356–4357
Yoshizawa T, Watanabe S, Hirose M et al (1997) Dimethylsulfoxide maintains intercellular communication by preserving the gap junctional protein connexin32 in primary cultured hepatocyte doublets from rats. J Gastroenterol Hepatol 12:325–330
Cegovnik U, Novakovic S (2004) Setting optimal parameters for in vitro electrotransfection of B16F1, SA1, LPB, SCK, L929 and CHO cells using predefined exponentially decaying electric pulses. Bioelectrochemistry 62:73–82
Acknowledgements
This work is supported by the Fund for Scientific Research Flanders (FWO-Vlaanderen), Belgium (grants G.0298.11, G.0571.12, G.0A54.13, and G.0320.15), the Special Research Fund (BOF) of Ghent University (grant 01IO8314), and the Interuniversity Attraction Poles Program (Belgian Science Policy, project P7/10).
Author information
Authors and Affiliations
Corresponding author
Editor information
Editors and Affiliations
Rights and permissions
Copyright information
© 2016 Springer Science+Business Media New York
About this protocol
Cite this protocol
Decrock, E., De Bock, M., De Baere, D., Hoorelbeke, D., Wang, N., Leybaert, L. (2016). Electroporation Loading and Dye Transfer: A Safe and Robust Method to Probe Gap Junctional Coupling. In: Vinken, M., Johnstone, S. (eds) Gap Junction Protocols. Methods in Molecular Biology, vol 1437. Humana Press, New York, NY. https://doi.org/10.1007/978-1-4939-3664-9_11
Download citation
DOI: https://doi.org/10.1007/978-1-4939-3664-9_11
Published:
Publisher Name: Humana Press, New York, NY
Print ISBN: 978-1-4939-3662-5
Online ISBN: 978-1-4939-3664-9
eBook Packages: Springer Protocols