
Abstract
The Bcl-2 family of proteins regulates the process of mitochondrial outer membrane permeabilization, causing the release of cytochrome c and committing a cell to apoptosis. The majority of the functional interactions between these proteins occur at, on, or within the mitochondrial outer membrane, complicating structural studies of the proteins and complexes. As a result most in vitro studies of these protein-protein interactions use truncated proteins and/or detergents which can cause artificial interactions. Herein, we describe a detergent-free, fluorescence-based, in vitro technique to study binding between full-length recombinant Bcl-2 family proteins, particularly cleaved BID (cBID) and BCL-XL, on the membranes of purified mitochondria.
Access provided by CONRICYT – Journals CONACYT. Download protocol PDF
Key words
- Apoptosis
- Bcl-2 family
- Detergent free
- Förster-resonance energy transfer
- FRET
- Protein interaction
- Mitochondria
1 Introduction
Mitochondrial outer membrane permeabilization (MOMP) generally commits cells to apoptosis through release of pro-apoptotic molecules such as cytochrome c and Smac/Diablo from the mitochondrial inner membrane space via. MOMP is regulated by interactions between Bcl-2 family proteins at, on, and within the mitochondrial outer membrane (MOM). The Bcl-2 family consists of anti-apoptotic and pro-apoptotic proteins that inhibit and promote MOMP, respectively. The anti-apoptotic proteins (Bcl-XL , Mcl-1, Bcl-2, A1) inhibit pro-apoptotic proteins by transient and stable direct binding interactions at mitochondria. The pro-apoptotic proteins have been subdivided into those that oligomerize to form pores within the MOM (e.g., BAX and BAK ), the direct activators of these proteins (e.g., BID, BIM), and those that sensitize cells to MOMP (e.g., BAD, NOXA) by inhibiting anti-apoptotic proteins through mutual sequestration [1].
In vitro techniques such as isothermal calorimetry or fluorescence anisotropy can be used to study protein-protein interactions in solution. However, it’s been demonstrated that the binding between several Bcl-2 family members, such as cBID and BAX , requires the presence of a membrane [2] that serves both as an active platform for the interactions of Bcl-2 family members and as the substrate permeabilized. Other common techniques such as co-immunoprecipitation are used to analyze interactions between proteins in solubilized cells; however the detergents needed can artifactually promote or prevent authentic Bcl-2 protein interactions [2, 3].
We have successfully used the fluorescence-based technique Förster-Resonance Energy Transfer (FRET) to study interactions between full-length recombinant Bcl-2 family proteins [2]. To make these measurements single-cysteine versions of the proteins are labeled with a pair of fluorophores in which the wavelengths of the light emitted by one (the donor) overlaps the excitation spectrum of the other (the acceptor). For the FRET experiments shown here, the donor is cBID labeled with Alexa 568 and the acceptor is BCL-XL labeled with Alexa 647. When the distance between the two fluorophores is small (less than 100 Å), the excited donor can transfer energy nonradiatively to the acceptor via dipole-dipole interactions. This energy transfer results in a decrease of the donor emission which we measure in our FRET experiments. FRET is a very sensitive method for detecting protein-protein interactions because the efficiency of FRET (E) decreases to the sixth power of distance (r):
where R 0 is the distance between a donor-acceptor pair at which the FRET efficiency is 50 %, also referred to as the Förster distance. For the donor-acceptor dye pair of Alexa 568 and Alexa 647, the reported R 0 is 82 Å [4]. To relate the observed FRET efficiency to binding between donor- and acceptor-labeled proteins requires a series of measurements in which the donor concentration is constant and the acceptor is titrated across a range of concentrations. Using such data it is possible to calculate a binding curve and a dissociation constant (K D) for the interaction between cBID and BCL-XL (Fig. 2).
For this assay single-cysteine mutants of cBID and BCL-XL were created and labeled with thiol-reactive maleimide derivatives of the dyes (ALEXA 568 and 647). Given the limited number of cysteine residues in the Bcl-2 family , we chose to create single-cysteine mutants of our proteins so we can label them with maleimide attached fluorophores. However, it is also possible to label free amino groups such as that of the Lysine side chain using succinimide esters and other commercially available reactive dyes. To measure FRET it is critical that only one position on the protein be labeled due to the distance dependence of the measurements. Single-cysteine mutants can be generated by site-directed mutagenesis. There are a myriad of fluorescent probes available that can react with the thiol group of the cysteine amino acid. The specific fluorophores used will depend on the system in question and the equipment available. The fluorescent experiments described here include mitochondria, which have intrinsic fluorescence in the higher energy visible/UV spectrum due to cytochromes [5], FADH, and other endogenous fluorophores from the cell [6]. Thus, we chose dyes with longer excitation and emission wavelengths for minimal interference. When labeling proteins one should set up a parallel reaction with a cysteine-less mutant to check for nonspecific labeling. We recommend following the labeling protocol supplied by the manufacturer of the fluorescent probe initially; however it is often the case that the protocol must be altered to optimize labeling efficiency and specificity for your protein of interest.
In cells, the pro-apoptotic proteins, BAX (Cytoplasmic and peripherally bound to mitochondria) and BAK (embedded in the MOM), bind to both BCL-XL and cBID; thus the endogenous BAX and BAK will compete for the fluorescent proteins we add to the reaction and will permeabilize the mitochondria complicating interpreting the data from our experiment. Thus, we use mitochondria purified from the liver of BAK deficient mice (Bak −/−) for the FRET assay described here. Liver cells from BAK −/− animals contain BAX ; however BAX is cytosolic and is washed from the mitochondrial pellet [7]. As Bcl-XL and Bid are mostly cytosolic and endogenous levels of Bcl-2 and Mcl-1 are low, there is little competition for these proteins when using mouse liver mitochondria. A series of purification steps are described below for the purification of mitochondria from dissected mouse liver.
To ensure the purified proteins are functional, we trigger the release of cytochrome c from mitochondria by using purified Bax and cBid and then measure how efficiently BCL-XL inhibits the process. This is done by adding purified proteins to mitochondria and immunoblotting for cytochrome c in the supernatant and pellet fractions. Retention of cytochrome c prior to MOMP is also an indication of the integrity of the mitochondria that were prepared. Proteins released from mitochondria are separated by pelleting the mitochondria by centrifugation. As a loading control for the immunoblots, we used heat shock protein 60 (HSP60) . The HSP60 protein is retained in the pellet, even if the outer mitochondrial membrane is permeabilized, since it is located within the mitochondrial matrix [8]. Active labeled proteins can then be used to obtain a FRET binding curve for the interaction between cBID and BCL-XL on mitochondrial membranes as described below.
2 Materials
2.1 Purification of Bcl-2 Family Recombinant Proteins
-
1.
BAX Lysis Buffer (pH 7): 10 mM HEPES, 100 mM NaCl, 0.2 % (m/v) CHAPS , 1 mM PMSF, DNase 10 μg/mL, 10 % (w/v) Glycerol. BAX Wash Buffer (pH 7): 10 mM HEPES, 500 mM NaCl, 0.5 % (w/v) CHAPS , 10 % (w/v) Glycerol. BAX Cleavage Buffer (pH 7): 10 mM HEPES, 200 mM NaCl, 0.2 mM EDTA , 0.1 % (w/v) CHAPS , 200 mM Hydroxylamine, 10 % (w/v) Glycerol (see Note 1 ). BAX Dialysis Buffer (pH 7): 10 mM HEPES, 200 mM NaCl, 0.2 mM EDTA , 10 % (w/v) Glycerol.
-
2.
BCL-X L Lysis Buffer (pH 8): 20 mM Tris (see Note 2 ), 500 mM NaCl, 0.5 mM EDTA , 1 % (w/v) CHAPS , 1 mM PMSF, DNase 10 μg/mL. BCL-X L Wash Buffer (pH 8): 20 mM TRIS, 200 mM NaCl, 0.2 % (w/v) CHAPS , 20 % (w/v) Glycerol, 1 mM PMSF. BCL-X L Cleavage Buffer (pH 8): BCL-XL Wash Buffer supplemented with 200 mM Hydroxylamine. BCL-X L Elution Buffer (pH 8): 20 mM TRIS, 0.2 % (w/v) CHAPS , 20 % (w/v) Glycerol. BCL-X L Dialysis Buffer (pH 8): 20 mM TRIS, 20 % (w/v) Glycerol.
-
3.
BID Lysis Buffer (pH 7): 10 mM HEPES, 100 mM NaCl, 10 mM Imidazole , DNase 10 μg/mL, 1 mM PMSF. BID Wash Buffer (pH 7): 10 mM HEPES, 300 mM NaCl, 1 % (w/v) CHAPS , 10 mM Imidazole . BID Elution Buffer (pH 7): 10 mM HEPES, 100 mM NaCl, 0.1 % (w/v) CHAPS , 200 mM Imidazole , 10 % Glycerol. BID Cleavage Buffer (pH 7): 50 mM HEPES, 100 mM NaCl, 0.1 % (w/v) CHAPS , 10 % (w/v) Glycerol, 1 mM EDTA , 10 mM DTT. BID Dialysis Buffer (pH 7): 10 mM HEPES, 100 mM NaCl, 0.1 mM EDTA , 10 % (w/v) Glycerol.
-
4.
LB-ampicillin (to make 1.5 L): 10 g Yeast Extract, 15 g NaCl, 150 mg Ampicillin Salt, 1.5 L Milli-Q dH2O.
-
5.
Human Caspase 8: such as from Enzo Life Sciences (Catalog number: ALX-804-447-C100).
2.2 Labeling Proteins with Donor and Acceptor Maleimide ALEXA Fluorophores
-
1.
100 % DMSO, anhydrous.
-
2.
Maleimide fluorophores from Molecular probes, Life Technologies: Alexa 647 C2-maleimide (Catalog number: A-20347), Alexa 568 C5-maleimide (Catalog number: A-20341).
-
3.
Dialysis Buffers: BAX —10 mM HEPES pH 7.0, 100 mM NaCl, 0.1 mM EDTA . BCL-XL —20 mM TRIS pH 8.0.
-
4.
10 % (w/v) CHAPS .
-
5.
Solution of 8 M Urea pH 7.0 in distilled water.
-
6.
1 M solution of Dithiothreitol (DTT) in distilled water (see Note 3 ).
-
7.
10 mM solution of the reducing agent tris(2-carboxyethyl)phosphine (TCEP).
-
8.
Sephadex G-25 fine beads from GE Healthcare Life Sciences (see Note 4 ).
-
9.
Ni-NTA agarose beads from Qiagen.
2.3 Mitochondria Preparation
-
1.
Mouse liver from BAK knockout mice (The Jackson Laboratory, stock number 004183).
-
2.
AT Buffer: 300 mM Trehalose, 10 mM HEPES-KOH pH 7.7, 10 mM KCl, 1 mM EGTA, 1 mM EDTA , 0.1 % BSA .
-
3.
AT-KCl Buffer: 300 mM Trehalose, 10 mM HEPES-KOH pH 7.7, 80 mM KCl, 1 mM EGTA, 1 mM EDTA , 0.1 % BSA .
-
4.
Regenerating Buffer: 300 mM Trehalose, 10 mM HEPES-KOH pH 7.7, 80 mM KCl, 1 mM EGTA, 1 mM EDTA , 0.1 % BSA , 5 mM Succinate, 2 mM ATP , 10 μM phosphocreatine, 10 μg/mL creatine kinase (see Note 5 ).
-
5.
Liquid nitrogen and dry ice (solid CO2).
-
6.
Potter-Elvehjem homogenizer (30 mL size).
2.4 Cytochrome c Release
-
1.
Obtain energized mitochondria from Subheading 3.3.
-
2.
Black, nonbinding surface, Corning 96 well plate (reference number 3881).
-
3.
Alexa 568 126C cBID and Alexa 647 152C BCL-XL from Subheading 3, and wild-type BAX from Subheading 3.1.
-
4.
Cytochrome c antibody (we make ours in-house, but it is commonly available for purchase through many biotechnology companies).
2.5 cBID–BCL-XL FRET Interaction in the Presence of Purified Mitochondria
-
1.
Purified cBID, and BCL-XL labeled with Alexa 586 and Alexa 647, respectively, from Subheading 3.2.
-
2.
Purified mitochondria from Subheading 3.3.
-
3.
Instrument capable of end-point fluorescence measurements. We used a TECAN Infinite M1000 PRO.
-
4.
Corning 96 well, clear bottom, half area, black, nonbinding surface plate.
3 Methods
3.1 Purification of Bcl-2 Family Recombinant Proteins
Unless otherwise stated, all protocols should be carried out on ice or 4 °C.
-
1.
Both BAX and BCL-XL are expressed with a carboxyl-terminal intein-chitin binding domain (IMPACT expression systems, New England Biolabs), while BID is expressed with an amino-terminal 6× Histidine Tag . Plasmids for BAX , BID, and BCL-XL are transformed into Escherichia coli (BL21-AI for BAX and BID, DH5α for BCL-XL , New England Biolabs), plated on LB-ampicillin agar, and incubated overnight at 37 °C. The next day, a single colony is used to inoculate a small culture of LB-ampicillin (~200 mL) and grown again overnight at 30–37 °C.
-
2.
The next day, take 30–40 mL of the confluent overnight cultures and inoculate 1.5 L cultures of LB-ampicillin. Grow cultures at 37 °C with shaking until they reach an optical density (OD600) between 0.6 and 0.8.
-
3.
Induce the 1.5 L cultures with 0.2 % (w/v) Arabinose (BAX and BID) or 1 mM IPTG (BCL-XL) . Reduce the temperature to 30 °C and continue to grow for an additional 4–5 h (see Note 6 ).
-
4.
Harvest the bacteria by centrifugation. Bacterial Pellets can then be stored at −20 °C.
-
5.
Resuspend the bacterial pellets in BAX , BCL-XL , or BID lysis buffer (~4 mL per bacterial gram) by vortexing and using an 18-gauge needle to remove large chunks. The bacterial lysates are then mechanically lysed via French Press or Homogenizer (AVASTIN) (see Note 7 ). Centrifuge the lysed samples and recover the supernatant.
-
6.
Add 1–2 mL of Chitin Bead Resin (New England Biolabs) to the recovered bacterial lysates of BAX and BCL-XL , and 1 mL of Ni-NTA Resin (Thermo Fisher Scientific) to BID. Let incubate for 1–2 h at 4 °C.
-
7.
Load the incubated lysates into Econo-Pac chromatography columns (BioRad), and allow the lysate to pass through several times. This ensures even packing and saturation of affinity beads.
-
8.
Wash each column with 50 mL of BAX , BCL-XL , or BID wash buffer. Elute BID from the column by adding 10 mL of BID elution buffer and collecting the first five 1 mL fractions. Perform a Bradford assay to quickly determine which fractions contain the highest concentration of BID. BID must first be labeled before continuing. Please refer to Subheading 3.2 for the labeling of BID, then return to step 10c for the cleavage of BID protocol.
-
9.
After washing BAX and BCL-XL columns, add 10 mL of freshly prepared BAX and BCL-XL cleavage buffer. Allow the first 8 mL to pass through, and then cap the column to retain ~2 mL of cleavage buffer. Let sit for 48 h at 4 °C. Afterwards, remove the column cap and elute BAX or BCL-XL (see Note 8 ).
-
10.
-
(a)
BAX : A 0.2 mL bed volume of DEAE-Sepharose beads is equilibrated with 2–3 mL of BAX cleavage buffer (without hydroxylamine added). The 2 mL BAX elution is passed through the column three to four times in order to remove nucleic acids that tend to elute with BAX .
-
(b)
BCL-XL : Equilibrate a 0.3 mL bed volume high-performance phenyl sepharose column with ~3 mL of BCL-XL wash buffer. Apply BCL-XL fractions from the chitin column, and wash again with ~5 mL of BCL-XL wash buffer. Elute BCL-XL with BCL-XL elution buffer (~3 mL). Collect three fractions and assess via Bradford to determine which has the highest concentration of BCL-XL .
-
(c)
BID: To make cBID (cleaved BID) take your labeled BID with the highest concentration (~1 mL) and add the appropriate amounts of buffer components to achieve cleavage buffer concentrations. I.e., BID Dialysis Buffer is at 10 mM HEPES, so add 40 mM HEPES to achieve a final concentration of 50 mM HEPES as stated in BID Cleavage Buffer. Add 500 U of human Caspase-8 (Enzo Life Sciences) to your BID aliquot, and leave for 48 h at room temperature to cleave.
-
(a)
-
11.
BAX , BID, and BCL-XL aliquots are then put into 16–18 kDa dialysis tubing, ensuring both ends of the tubing are securely clipped. These proteins are dialyzed with BAX , BID, and BCL-XL Dialysis buffer respectively, 1 L for 4 h, 2 L overnight, then 1 L for 4 h the next morning.
-
12.
Proceed to Subheading 3.2 Labeling of Proteins before completing step 13 below.
-
13.
Repeat dialysis step 11 for BAX and BCL-XL after labeling the proteins.
-
14.
Proteins can then be aliquoted into non-stick hydrophobic tubes (Fisher Scientific), flash-frozen with liquid nitrogen, and stored at −80 °C.
3.2 Labeling of Proteins with Donor and Acceptor Maleimide ALEXA Fluorophores
Steps are carried out at room temperature unless otherwise indicated.
-
1.
For BID, BAX , and BCL-XL , the labeling reaction is carried out after dialysis of the protein (see Note 9 ). Ensure the pH of the protein sample to be labeled is between 7.0 and 7.5, which is suitable to allow the cysteines to be most reactive, while lowering the reactivity of primary amines that could potentially be labeled (see Note 10 ).
-
2.
Adjust the buffer conditions of the protein sample such that CHAPS is increased to 0.5 % of the final volume. The dye is typically dissolved in DMSO and the amount of dye added to the protein sample should be 10–15 times the mole amount of protein in the reaction.
-
3.
Add the reducing agent, TCEP, four times the mole amount of protein to prevent disulfide bond formation (see Note 11 ).
-
4.
The reaction should rotate in a microfuge tube wrapped in foil at room temperature for 2–3 h (see Note 12 ). After the specified time has elapsed, quench the reaction with 1 mM DTT .
-
5.
-
(a)
Apply BAX or BCL-XL labeled protein solution to a pre-equilibrated (with the appropriate dialysis buffer) G25 column with a bed volume ten times the reaction volume (e.g., 1.5 mL reaction volume = 15 mL). Discard the flow through and add dialysis buffer to the top of the column whilst collecting 500 μL fractions (see Note 13 ).
-
(b)
Apply BID labeled protein solution to the Ni-NTA column (0.2 mL bed volume of beads) and pass through the column three times to ensure all labeled protein binds. The column is washed with 50 mL of BID wash buffer, and eluted with 5 mL of BID elution buffer (see Note 14 ).
-
(a)
-
6.
Pool the fractions with the most protein and check the percent labeling efficiency by dividing the concentration of the dye by the concentration of the protein and multiplying by 100 (see Note 15 ).
$$ \%\kern0.5em \mathrm{Labeling}\kern0.28em \mathrm{Efficiency}=\left(\frac{\left[\mathrm{Dye}\right]}{\left[\mathrm{Protein}\right]}\right)\times 100 $$ -
7.
Dialyze the final labeled protein sample once again using dialysis buffers with 20 % glycerol.
-
8.
After dialysis is complete, measure the protein and dye concentration again to get a final % labeling efficiency. Aliquot the labeled, dialyzed protein into one-time use samples. Proteins should be flash-frozen with liquid nitrogen, should be kept in solution with at least 10 % glycerol, and should never be re-frozen after use.
The labeled protein needs to be assayed for functionality before use in a FRET assay. Labeling could potentially alter protein folding, orientation, or steric inactivation of binding sites. The activities of these proteins are tested for release of cytochrome c in the presence of mitochondria as described in the next section.
3.3 Mitochondria Preparation
Steps are carried out at room temperature unless otherwise indicated. Procedure adapted from Yamaguchi et al. [9].
-
1.
Euthanize mice (BAK−/−) using CO2 and remove liver. Place in 20 mL AT buffer. You can process up to four livers at once.
-
2.
Wash liver sample five times in 5–10 mL of AT buffer to remove erythrocytes (see Note 16 ).
-
3.
Mince liver using surgical scissors in 5 mL/liver of ice-cold AT. Adjust volume to 30 min.
-
4.
Homogenize the minced tissue using four strokes (one stroke is up and down) of a motor-driven Potter-Elvehjem homogenizer (30 mL size).
-
5.
Centrifuge homogenate for 10 min at 600 × g to remove tissue components.
-
6.
Remove the supernatant to a fresh tube and centrifuge for 15 min at 3500 × g.
-
7.
Decant the supernatant carefully (see Note 17 ).
-
8.
Transfer the supernatant to a fresh tube and centrifuge at 5500 × g for 10 min.
-
9.
Resuspend the final mitochondrial pellet to the required protein concentration in AT buffer and freeze (described below). For four livers, add 50 μL of AT buffer initially, measure the protein concentration by Bradford Assay, then adjust the volume so that the final protein concentration is no more than 50 mg/mL (see Note 18 ). Quickly move to the freezing step.
Freezing
-
1.
Obtain dry ice and crush into small pellets in an ice bucket (see Note 19 ).
-
2.
Set up prechilled, labeled microfuge tubes by setting them in the dry ice.
-
3.
Dispense 10 μL into the prechilled tubs without touching the tip to the side of the tube (see Note 20 ). The mitochondria will freeze as soon as they touch the cold tube.
-
4.
Place each tube immediately into liquid nitrogen after each aliquot is pipetted, and store aliquots at −80 °C until ready to use.
-
5.
When mitochondria are needed for FRET assays, use the mitochondria regeneration protocol described below. After aliquots are frozen, they are one-time use samples and should not be re-frozen.
Mitochondria regeneration
-
1.
Rapidly thaw a mitochondria aliquot by holding tube between your fingers and then place on ice.
-
2.
Wash mitochondrial pellet by washing once in AT-KCl buffer, spinning the pellet down at 10,000 × g for 10 min, removing the supernatant, and resuspending the pellet in regenerating buffer.
-
3.
The regenerated mitochondria can be used directly for fluorescence assays.
3.4 Cytochrome c Release
Here we need to ensure that our proteins are functional by either releasing cytochrome c (BID + BAX ) or inhibiting release of cytochrome c (BID + BAX + BCL-XL ). This is also an indication of the integrity of the mitochondria that were prepared. With immunoblot analysis, we should see that the mitochondria pellet retains cytochrome c while the addition of BID and BAX should release cytochrome c into the supernatant.
-
1.
Using the regenerated mitochondria from Subheading 3.3, add 98–100 μL (depending on how much protein you are adding) to each well desired in a 96 well plate (see Note 21 ).
-
2.
Add proteins to the desired wells. We will need one with only mitochondria, one well with Alexa 568 cBID 4 and 25 nM BAX to release cytochrome c from the mitochondria, and the rest containing the same concentration of cBID and BAX plus a titration of Alexa 647 BCL-XL from 4 to 20 nM (see Note 22 ).
-
3.
Mix well and incubate the plate at 37 °C for an hour.
-
4.
Spin down the plate, or transfer each reaction into non-stick tubes and spin at 5000 × g for 5 min. Separate the pellet and supernatant. Resuspend the mitochondrial pellet in an equal volume (100 μL) of regeneration buffer.
-
5.
Add 2× loading buffer to each sample and run standard polyacrylamide gel electrophoresis to resolve proteins. Transfer proteins to PVDF or nitrocellulose western blotting paper and carry out standard immunoblotting with the cytochrome c antibody (1:5000 dilution). Figure 1 shows cytochrome c release of mitochondria in either the pellet or supernatant fractions.
Fig. 1 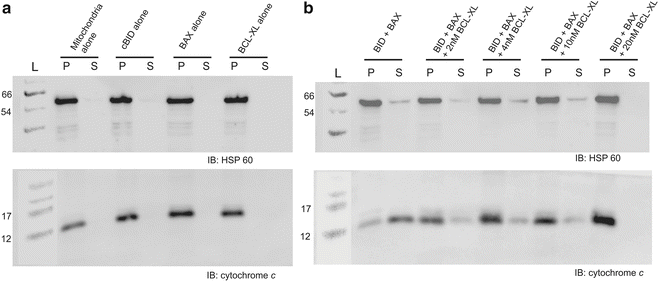
Cytochrome c release from purified mitochondria using BID and BAX , which is inhibited by BCL-XL . (a) The pellet (P) and supernatant (S) fractions are shown for the mitochondria alone, 2 nM cBID protein alone, 10 nM Bax protein alone, and 20 nM BCL-XL protein alone. Immunoblotting for cytochrome c , and the loading control HSP60. (b) The pellet and supernatant fractions are shown for 2 nM BID + 10 nM BAX, and a titration of BCL-XL from 4 to 20 nM. Blots were stained for HSP60 loading control and cytochrome c as labeled

3.5 Measuring the Interaction Between cBID and BCL-XL in Mitochondria Using FRET
-
1.
Mitochondria are obtained (Subheading 3.3) at a concentration of 1 mg/mL.
-
2.
The fluorimeter (TECAN Infinite M1000 PRO) is set to record the fluorescence of Alexa 647 (567 nm excitation, 5.0 nm slit width; 600 nm emission, 10 nm slit width) at 37 °C reading once per minute. Frequency set to 400 Hz and 50 flashes with an integration time of 2 μs. Instrument reads from the bottom of the plate (wells have clear bottoms).
-
3.
98–100 μL of regenerated mitochondria from Subheading 3.3 is added into 16 wells of a 96 well plate. The signal is read for 15 min or until the signal remains stable. Two reactions are required for the detection of a FRET interaction; one that contains both the donor-labeled cBID and acceptor-labeled BCL-XL (F DA) and a control that contains the donor-labeled cBID and unlabeled acceptor BCL-XL (F D) to account for environment changes that may affect the signal of the donor fluorophore (see Note 23 ).
-
4.
After the mitochondria background read, obtain an initial fluorescence reading (F 0) by adding 4 nM Alexa 568 cBID to each well and collecting data again for 10–15 min so the reaction reaches 37 °C. Also, it is important to ensure that the addition of the donor alone reaches a stable plateaued signal at the desired temperature.
-
5.
To obtain the final fluorescence read (F), add either labeled Alexa 647 BCL-XL or unlabeled BCL-XL to the wells as described and read for 1–2 h at 1 min intervals.
-
6.
When 1–2 h have passed or the kinetic data reaches a plateau, average the values for the last 10–15 min of the assay. Divide the averaged points for each well from F and F 0 (F/F 0) for each well to normalize data collected (see Note 24 ).
-
7.
The % FRET efficiency (E) can be obtained by comparing the relative fluorescence intensities of the donor in the presence and absence of the acceptor with the following calculation:
$$ \%\kern0.28em E=\left(1-\frac{F_{\mathrm{D}\mathrm{A}}}{F_{\mathrm{D}}}\right)\times 100 $$where F DA is the F/F 0 value for the donor-labeled protein in the presence of the acceptor-labeled protein, and F D is the F/F 0 value for the donor-labeled protein in the presence of the unlabeled acceptor.
-
8.
By plotting the FRET efficiency against the concentration of the acceptor used in the plate, one can obtain a binding curve as shown in Fig. 2 for the FRET interaction between donor-labeled cBID and acceptor-labeled BCL-XL .
Fig. 2 
cBID interacts with BCL-XL in the presence of purified mitochondria. The donor concentration was kept constant at 4 nM while the concentration of the acceptor was titrated from 0 to 20 nM as indicated. Each data point represents an experiment done in triplicate with n = 3
-
9.
Fit the data to the equation below to find the dissociation constant (K D) for this interaction (see Note 25 ):
$$ f\left(\left[{B}_0\right]\right)=\frac{\left[ AB\right]}{\left[{A}_0\right]}=\frac{\left[{A}_0\right]+\left[{B}_0\right]+{K}_{\mathrm{D}}-\sqrt{\left(\left[{A}_0\right]+\left[{B}_0\right]+{K}_{\mathrm{D}}\left){}^2-4\left[{A}_0\right]\right[{B}_0\right]}}{2\left[{A}_0\right]} $$where [A 0] is the initial concentration of the donor protein, [B 0] is the concentration of the donor protein when system reaches equilibrium.

4 Notes
-
1.
The addition of hydroxylamine lowers the pH of the cleavage buffers. Be sure to adjust the pH of the buffers using NaOH. Hydroxylamine is used instead of other reducing agents since cleavage of the intein with hydroxylamine will not leave a free thiol group as is the case for cleavage with DTT or BME. This free thiol is labeled with maleimide dyes and therefore using hydroxylamine is required to prevent unwanted labeling of the protein.
-
2.
The pH of TRIS buffers is temperature dependent and will change with decreasing temperature. Make sure to adjust the pH again after cooling the buffers to 4 °C.
-
3.
1 mL of 1 M DTT will last for many labeling reactions. When not using DTT , keep frozen at −20 °C.
-
4.
Beads can be reused by washing with four column volumes of dialysis buffer and stored at 4 °C (can also refer to the manufacturers specifications for bead storage and regeneration).
-
5.
This buffer was designed to regenerate the mitochondrial inner membrane transmembrane potential. Add 5 μL creatine kinase (5 mg/mL) from a stock stored at −20 °C into the 500 μL mitochondrial sample.
-
6.
For increased protein yield and reduced degradation, the induced bacterial cultures can be grown at 17 °C overnight.
-
7.
Mechanical lysis produces heat; take frequent breaks to ensure samples remain at 4 °C. Keep all samples chilled at 4 °C for the remainder of the protocol.
-
8.
Hydroxylamine in the cleavage buffer causes cleavage of the intein-chitin binding domain, allowing full-length BAX or BCL-XL to be eluted 48 h later.
-
9.
Labeling of BID can be performed prior to cleavage and dialysis. Imidazole in the buffer does not affect the labeling reaction. For proteins fused with intein-chitin binding domain (BAX , BCL-XL ), hydroxylamine instead of other common reagents such as beta-mercaptoethanol or DTT is used to induce intein self-cleavage. Hydroxylamine-induced self-cleavage does not leave a thiol group at the C-terminus of the protein, preventing potential labeling at the c-terminus of the protein. Hydroxylamine needs to be removed by dialysis prior to labeling.
-
10.
The total reaction volume for BID, BAX , and BCL-XL would typically be 1–1.5 mL with a protein concentration of 10–100 μM depending on the yield from protein purification.
-
11.
If labeling efficiency is low, you can try adding urea to the reaction at a final concentration of 1 M to help expose cysteine residues.
-
12.
The reaction can be incubated at 4 °C overnight. Also, you can increase the room temperature incubation for an hour or two if labeling efficiencies are low, but if you are increasing the incubation time, ensure that your cysteine-less labeling control is not being labeled.
-
13.
For this step, use the protein’s dialysis buffer without glycerol to elute from the G25 column. With the bright Alexa Fluor dyes, you should be able to see the labeled protein fraction travel down the column faster than the free, unreacted dye. Typically the labeled protein will elute in the 12th–15th fractions. If you use multiple dyes on the column be sure to thoroughly wash the column before adding the next labeling reaction to prevent contamination between dyes. Rather than collecting fractions of a specific volume, it is easier to collect the protein as you see it coming out of the column since the labeled protein is intensely colored. Use the same wash and elution buffers from the BID purification method.
-
14.
Typically we use protein samples that are >80 % labeled for our fluorescence-based assays. Also, dialysis of the protein sample will remove any free dye that might still be in the final elution from the G25 column. Protein concentration is typically measured by Bradford assay (BID), protein A280 (BAX ), or BCA assay (BCL-XL ) while the dye concentration is measured by the optical density of the sample at the peak absorbance wavelength and molar extinction coefficient of the dye provided by the product information.
-
15.
We find that using nonbinding surface, hydrophobic microtubes are best to store these proteins.
-
16.
You can set up two glass jars with a small volume of AT buffer. Pick up the mouse liver with forceps and wash the livers in the first jar, and do a final rinse in the second jar. You want to do this until the jar of buffer the livers are washed in remains clean.
-
17.
Occasionally, there is an adipose layer that floats on top of the desired supernatant that you should avoid collecting.
-
18.
Mitochondria at a concentration greater than 50 mg/mL may not contain enough trehalose to stabilize them, thus higher concentrations of mitochondria are not recommended [9].
-
19.
Liquid nitrogen also works for flash freezing mitochondria.
-
20.
Only pipette 10 μL to facilitate quick freezing. Do not touch the pipette tip to the tube or the mitochondria will freeze in the tip. If this does occur, discard the aliquot and the frozen mitochondria in the tip.
-
21.
With this assay, we fill eight wells. One well with only mitochondria, one well with just cBID and BAX , and the rest of the wells with cBID, BAX , and a titration of BCL-XL from 1 to 20 nM. Also, the in vitro proteins used will be Alexa 568 126C cBID, Alexa 647 152C BCL-XL , and wild-type BAX .
-
22.
To try and optimize the distance for better FRET efficiencies for a protein-protein interaction with a given donor-acceptor pair, you can label different single-cysteine mutants. You may get a better idea of the orientation of these labels by looking at the structures of the proteins in question, if available.
-
23.
Similar plate setup to Subheading 3.4. One well will contain only mitochondria, while the rest will contain Alexa 568 cBID and a titration with Alexa 647 BCL-XL from 0.1 to 20 nM. Set up row A (fluorescence with the donor and acceptor, F DA) with eight wells, and row B (fluorescence with the donor and the unlabeled acceptor protein, F D) with eight wells. The wells in row A will contain the donor and the acceptor for the main fluorescence measurement. The wells in row B will contain a control for row A, the donor and the unlabeled acceptor.
-
24.
For example, for one well in row A, take the average of the last 10 points in the F measurement and divide by the average of the last 10 points in the F 0 measurement. Because row A contains fluorescently labeled acceptor protein, the value you obtain for this F/F 0 is the F DA value for that well.
-
25.
For Bcl-2 family proteins, it is common that the concentration of donor used in the experiment is greater than the dissociation constant in the nM range. If this is the case, we cannot use the conventional Hill slope equation to fit our curve. Instead we need to use a modified equation that takes into account the protein concentration as explained by Shamas-Din et al. [10]. In short, for the binding interaction between cBID and BCL-XL we can create the equation A + B → AB, where A is cBID and B is BCL-XL , with the dissociation constant equal to:
If [A] << K D, then we can exclude [A] from the equation (Hill slope) and it becomes much simpler to fit the curve:
where f is the fraction of bound molecule.
However, when the K D is below 100 nM, as frequently seen within the Bcl-2 family [A] is not <<K D, so we need to take [A] into account. Thus, using the form of the quadratic equation and the appropriate substitutions given our new equation, the expression for the equation to fit the binding curve becomes:
Lastly, since we are using FRET to produce our binding curve, we assume our FRET signal is proportional to the fraction bound. When the FRET efficiency is half of the maximum fret efficiency of the curve, then [B] = K D.
References
Shamas-Din A, Kale J, Leber B, Andrews DW (2013) Mechanisms of action of Bcl-2 family proteins. Cold Spring Harb Perspect Biol 5(4):a008714
Lovell J, Billen L, Binder S, Shamas-Din A, Fradin C, Leber B, Andrews D (2008) Membrane binding by tBid initiates a series of events culminating in membrane permeabilization by Bax. Cell 135:1074–1084
Hsu YT, Youle RJ (1997) Nonionic detergents induce dimerization among members of the Bcl-2 family. J Biol Chem 272(21):13829–13834
Johnson I, Spence MTZ (2010) The molecular probes handbook. Life Technologies Corporation, Eugene, OR
Esteve‐Núñez A, Sosnik J, Visconti P, Lovley DR (2008) Fluorescent properties of c‐type cytochromes reveal their potential role as an extracytoplasmic electron sink in Geobacter sulfurreducens. Environ Microbiol 10:497–505
Tohmi M, Takahashi K, Kubota Y, Hishida R, Shibuki K (2009) Transcranial flavoprotein fluorescence imaging of mouse cortical activity and plasticity. J Neurochem 109(s1):3–9
Shibasaki F, Kondo E, Akagi T, McKeon F (1997) Suppression of signalling through transcription factor NF-AT by interactions between calcineurin and Bcl-2. Nature 386(6626):728–731
Cechetto JD, Soltys BJ, Gupta RS (2000) Localization of mitochondrial 60-kD heat shock chaperonin protein (Hsp60) in pituitary growth hormone secretory granules and pancreatic zymogen granules. J Histochem Cytochem 48(1):45–56
Yamaguchi R, Andreyev A, Murphy AN, Perkins GA, Ellisman MH, Newmeyer DD (2007) Mitochondria frozen with trehalose retain a number of biological functions and preserve outer membrane integrity. Cell Death Differ 14(3):616–624
Shamas-Din A, Satsoura D, Khan O, Zhu W, Leber B, Fradin C, Andrews DW (2014) Multiple partners can kiss-and-run: Bax transfers between multiple membranes and permeabilizes those primed by tBid. Cell Death Dis 5:e1277
Acknowledgments
Funding was provided by the Canadian Institutes of Health Research (CIHR) grant FRN12517 to DWA.
Author information
Authors and Affiliations
Corresponding author
Editor information
Editors and Affiliations
Rights and permissions
Copyright information
© 2016 Springer Science+Business Media New York
About this protocol
Cite this protocol
Pogmore, J.P., Pemberton, J.M., Chi, X., Andrews, D.W. (2016). Using Förster-Resonance Energy Transfer to Measure Protein Interactions Between Bcl-2 Family Proteins on Mitochondrial Membranes. In: Puthalakath, H., Hawkins, C. (eds) Programmed Cell Death. Methods in Molecular Biology, vol 1419. Humana Press, New York, NY. https://doi.org/10.1007/978-1-4939-3581-9_15
Download citation
DOI: https://doi.org/10.1007/978-1-4939-3581-9_15
Published:
Publisher Name: Humana Press, New York, NY
Print ISBN: 978-1-4939-3579-6
Online ISBN: 978-1-4939-3581-9
eBook Packages: Springer Protocols