
Abstract
Immunohistochemical analysis has been a key clinical tool that shows the protein expression of molecular markers. Expression of molecular markers in breast pathology has been used to distinguish breast cancers from benign lesions, classify subtypes of breast cancers, and determine therapeutic intervention. It is a relatively fast and efficient option in stratifying breast lesions to assist in both determining pathology diagnosis and offer strategies to the best course of clinical action. In this chapter, we discuss the use of immunohistochemistry testing for some of the key molecular markers involved in breast pathology that are crucial for classifying breast cancers and the guidelines for the interpretation of testing results that assist in clinical management.
Access provided by CONRICYT – Journals CONACYT. Download protocol PDF
Key words
1 Introduction
From the histopathologic examination of biopsies and resection specimens (lumpectomies, mastectomies, and metastatic lesions), useful prognostic information such as lesion type (ductal vs. lobular), tumor differentiation (well, moderately, and poorly differentiated), invasiveness, lymphovascular invasion , lymph node status, and when applicable, tumor size is derived. Most of this information can be derived from the cytological and histological morphology observed by hematoxylin and eosin (H & E) staining.
However, the utility of these traditional morphology-based parameters can be limited in providing accurate risk assessment per patient, both in terms of local or distant recurrence and in terms of providing the best options for treatment. Cytological and histological analyses by themselves give little information about the specific expression of proteins that are tightly associated to prognosis. In fact, multiple molecular markers have been identified to help differentiate one type of breast lesion from another, determine invasiveness of the tumor, help define lymphovascular invasion , and allow breast cancers to be stratified into different groups associated with variable degrees of survivability. Here, we will discuss how immunohistochemistry techniques can be used towards these applications.
2 Materials
2.1 Tissue Processing
10 % Formalin, 100 % ethanol, 95 % ethanol, xylene, paraffin.
2.2 Immunohistochemistry Slide Prepping
EZPrep, cell conditioning buffer #1 are pre-made solution reagents created by Ventana Medical Systems, Inc. (Ventana) used in immunohistochemistry (IHC) reactions carried out on VENTANA BenchMark XT automated slide staining systems (see Note 1).
-
1.
Deparaffinization fluid: 1× EZPrep. EZPrep is an aqueous-based detergent. 10× EZPrep is diluted with nine parts deionized H2O.
-
2.
Cell conditioning buffer #1 (CC1): This is a slightly basic, Tris-based buffer.
-
3.
Reaction buffer: Tris-based buffer at pH 7.6 used for rinsing slides. 10× Reaction buffer is diluted with nine parts deionized H2O.
-
4.
Wash buffer: 1× SSC buffer. This is a sodium chloride/sodium citrate buffer which acts as a stringent aqueous wash buffer. 10× SSC buffer is diluted with nine parts deionized H2O.
-
5.
Rinse buffer: 1× phosphate buffer saline (PBS).
-
6.
Liquid coverslip (LCS; a combination of low-density, paraffinic hydrocarbon and mineral oil).
2.3 Immunohistochemistry Staining Via the UltraView Universal DAB Detection Kit by Ventana
This detection system (including primary antibodies unless otherwise specified) is created by Ventana Medical Systems, Inc. (Ventana) used in immunohistochemistry (IHC) reactions performed on VENTANA BenchMark XT automated slide staining platforms (see Note 1).
-
1.
Primary antibodies—mouse monoclonal p63 (clone 4A4) (see Note 2), mouse monoclonal SMMHC (clone SMMS-1) (see Note 2), mouse monoclonal E-cadherin (clone 36) (see Note 4), mouse monoclonal Pancytokeratin (clones AE1/AE3/PCK26) (see Note 6), rabbit monoclonal CDX2 (clone EPR2764Y) (see Note 7), rabbit monoclonal ER (clone SP1) (see Notes 8 and 9), rabbit monoclonal PR (clone 1E2) (see Notes 8 and 9), rabbit monoclonal HER2 (clone 4B5) (see Notes 8 and 9), rabbit monoclonal Ki67 (clone 30-9) (see Note 10).
-
2.
UV INHIBITOR—3 % H2O2.
-
3.
UV HRP UNIV MULT—Cocktail of goat anti-mouse IgG/IgM and goat anti-rabbit IgG that are conjugated to horse-radish peroxidase (HRP) @ a concentration of ~50 μg/mL.
-
4.
UV DAB chromogen—0.2 % aqueous solution of 3, 3′-diaminobenzidine tetrahydrochloride.
-
5.
UV H2O2—0.04 % H2O2 in 1× phosphate buffer solution (PBS).
-
6.
UV Copper—Aqueous copper sulfate solution @ 5 g/L in acetate buffer.
-
7.
Hematoxylin—48 % Hematoxylin dye in glycol and acetic acid.
-
8.
Bluing reagent—Contains 0.1 M lithium carbonate in 0.5 M sodium carbonate aqueous solution.
2.4 Mammaglobin and GATA3 Immunohistochemistry
Mammaglobin immunohistochemistry was performed at Quest laboratories (see Note 7). GATA3 immunohistochemistry was performed by Clarient Diagnostic Services (see Note 7). Interpretations of these studies were performed at Stony Brook University Hospital.
3 Methods
3.1 Tissue Processing
Tissue sections are processed according to the automated processing protocol used at Stony Brook Hospital Histopathological Laboratories.
Tissue processing for tissue blocks from lumpectomies and mastectomies:
-
1.
Two-cycle incubation in 10 % formalin for 1½ h @ 42 °C, 15 mmHg.
-
2.
One-cycle incubation in 60 % ethanol for 1 h @ 42 °C, 15 mmHg.
-
3.
Two-cycle incubation in 95 % ethanol for 1 h @ 42 °C, 15 mmHg.
-
4.
Three-cycle incubation in 100 % ethanol for 1 h @ 42 °C, 15 mmHg.
-
5.
Two-cycle incubation in Xylene for 1 h @ 42 °C, 15 mmHg.
-
6.
Two-cycle incubation in Paraffin for 1½ h @ 60 °C, 15 mmHg.
Tissue Processing for Tissue Blocks from Biopsies
-
1.
Two-cycle incubation in 10 % formalin for 15 min @ 42 °C, 15 mmHg.
-
2.
One-cycle incubation in 60 % ethanol for 15 min @ 42 °C, 15 mmHg.
-
3.
Two-cycle incubation in 95 % ethanol for 15 min @ 42 °C, 15 mmHg.
-
4.
Three-cycle incubation in 100 % ethanol for 15 min @ 42 °C, 15 mmHg.
-
5.
One-cycle incubation in xylene for 10 min @ 42 °C, 15 mmHg.
-
6.
One-cycle incubation in xylene for 15 min @ 42 °C, 15 mmHg.
-
7.
One-cycle incubation in paraffin for 10 min @ 42 °C, 15 mmHg.
-
8.
One-cycle incubation in paraffin for 15 min @ 42 °C, 15 mmHg.
Immunohistochemistry slide prepping (see Subheading 3.2) and staining (see Subheading 3.3) are performed according to the BenchMArk XT IHC/ISH Staining Module protocols by Ventana.
3.2 Immunohistochemistry Slide Prepping
-
1.
Using a microtome, obtain tissue section from block 4 μM in thickness.
-
2.
Place sections of formalin-fixed paraffin-embedded (FFPE) tissue on positively charged glass slides.
-
3.
Warm slide to 75 °C, and incubate for 4 min.
-
4.
Apply EZPrep and rinse with 1× PBS. Repeat twice.
-
5.
Apply Liquid coverslip (LCS), warm slide to 76 °C, and incubate for 4 min.
-
6.
Rinse slide with 1× PBS, and apply Liquid coverslip (LCS).
-
7.
Wash with 1× SSC wash buffer, warm slide to 95 °C, and incubate for 8 min.
-
8.
Apply cell conditioner #1 and LCS.
-
9.
Warm slide to 100 °C, and incubate for 4 min.
-
10.
Apply LCS and cell conditioner #1. Repeat four times.
-
11.
Apply LCS and incubate for 8 min.
-
12.
Rinse slide with reaction buffer.
-
13.
Apply LCS. Rinse slide with reaction buffer.
3.3 Immunohistochemistry Staining
-
1.
Obtain prepped slide (from Subheading 3.2).
-
2.
Warm slide to 37 °C, and incubate for 4 min.
-
3.
Rinse with reaction buffer.
-
4.
Add one drop of UV INHIBITOR, apply LCS and incubate for 4 min.
-
5.
Rinse slide with reaction buffer, and warm slide to 37 °C for 4 min.
-
6.
Add LCS, then one drop of primary antibody and incubate for 8 min.
-
7.
Rinse slide with reaction buffer, add LCS, and warm to 37 °C for 4 min. Apply one drop of UV HRP UNIV MULT, add coverslip and incubate for 8 minutes. Rinse with reaction buffer.
-
8.
Apply reaction buffer, add one drop of UV DAB and one drop of UV DAB H2O2.
-
9.
Rinse with reaction buffer.
-
10.
Apply one drop of UV COPPER, apply LCS, and incubate for 4 min.
-
11.
Rinse with reaction buffer.
-
12.
Apply one drop of HEMATOXYLIN, LCS, and incubate for 4 min.
-
13.
Rinse with reaction buffer, and apply LCS. Repeat once.
-
14.
Add one drop of BLUING REAGENT, apply LCS, and incubate for 4 min.
-
15.
Rinse with reaction buffer, and then wash with 1× SSC.
-
16.
Add one drop of mounting solution, cover the slide with a glass coverslip and allow drying before histological examination.
3.4 Hematoxylin and Eosin (H & E) Staining
Performed according to the BenchMArk XT H & E Staining Module protocol by Ventana.
4 Notes
-
1.
Principles of immunohistochemistry.
The UltraView Universal DAB Detection Kit by Ventana is a detection system used in immunohistochemistry (IHC) reactions carried out on VENTANA BenchMark XT automated slide staining platforms. This system is based on a biotin-free method for staining antigens bound by mouse or rabbit IgG antibodies on formalin-fixed, paraffin-embedded tissue sections. Together, the automated platform allows for efficient, staining of multiple slides in real time with high efficiency.
Tissue sections are processed with incubations in different solutions (formalin, ethanol) which freeze cellular functions and preserves cellular components through crosslinking carboxy and amino groups (formalin) or by protein coagulation (ethanol). Incubation with xylene perforates cell membranes for easier staining of cellular components while preserving cellular integrity. Incubation with paraffin allows for long term storage. However, this “fixed” state must be partially reversed for adequate staining of tissue sections. The immunostaining prepping process achieves this by using the EZPrep detergent solution, along with heating, to deparaffinize tissue. Cell conditioning buffer reverses covalent bonds formed during the formalin fixation process, thus renaturing proteins and preserving epitope antigenicity for proper antibody affinity. Reaction buffer (a Tris-based buffer at an appropriate pH 7.6) supplies an adequate aqueous medium for the antibodies to bind their respective targets.
Liquid coverslip (LCS; a combination of low density, paraffinic hydrocarbon and mineral oil) provides a semipermeable liquid barrier allowing reagents to contact the tissue section, but preventing excessive evaporation of water.
The immunohistochemistry staining assaying is based on an indirect immune complex reaction incorporating the protein target of interest, a respective primary antibody and a secondary antibody conjugated to horse-radish peroxidase (HRP) to label the protein of interest via a chromogen precipitate reaction. To reduce background signal from nonspecific reactions, endogenous tissue peroxidases are inactivated with a high dose of hydrogen peroxide (UV INHIBITOR). The tissue section is then incubated with the primary antibody (in most cases a mouse or rabbit IgG) to label the specific protein of interest. This antibody/antigen complex is then incubated with UV HRP UNIV MULT containing secondary antibodies goat anti-mouse or goat anti-rabbit IgG conjugated to HRP. The secondary antibody binds to the primary antibody. The HRP motif, in the presence of copper and low concentration of hydrogen peroxide, drives an oxidation reaction of the DAB chromogen, generating a brown precipitate at the site of the antibody/antigen complex, which can be visualized on the tissue section with the cellular background highlighted by hematoxylin and bluing reagent.
Using the above techniques, detection of specific protein expression or lack thereof can help pathologists assess invasiveness of breast lesions, origin of breast lesions, or lymph node metastasis , determine metastasis of mammary origin and help predict patient prognosis by detection of prognostic factors.
-
2.
Invasiveness: absence of myoepithelial cells (MECs).
Breast lobules and ducts are composed of two cell types: An outer myoepithelial cell (MEC) layer and an inner luminal epithelial cell layer [1]. The existence of these two cell layers is an important feature in separating precancerous (in situ) lesions from invasive cancers, as most invasive cancers can be characterized by their loss of association to MECs. Each layer expresses a different combination of cytokeratins (CKs) [2]. Studies have demonstrated that MECs express cytokeratins CK5, CK14, and CK17 [3], neuroendocrine marker S100 [4], and cytoskeletal elements such as smooth muscle actin (SMA), smooth muscle heavy chain myosin (SMMHC), and calponin [5]. MECs also express p63, a homologue to the tumor suppressor protein p53 [6].
Although these proteins are not exclusive to MECs, they are not expressed in intraductal luminal cells. In fact, p63, SMMHC, and calponin have been described as the most sensitive and specific combination of targets for immunohistochemical staining [5]. The nuclear staining of p63 and the cytoplasmic staining of SMMHC and calponin highlight the absence of MECs, providing evidence of malignancy. These immunohistochemical markers are very useful in distinguishing benign entities with histological patterns similar to invasive carcinoma, such as in a benign lesion like sclerosing adenosis [3] (Fig. 1), and also in other cases to demonstrate areas of invasion at sites of in situ carcinoma [7] (Fig. 1).
Fig. 1 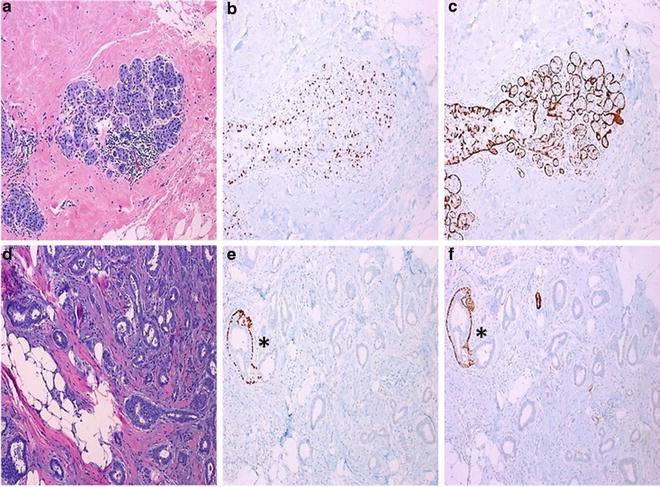
Myoepithelial markers. Sclerosing adenosis (a–c). (a) Hematoxylin–eosin staining with (b) corresponding p63 (clone 4A4) and (c) smooth muscle myosin heavy chain (SMMHC, clone SMMS-1) highlighting the myoepithelial cells at 100×. Invasive ductal carcinoma (d–f). Note the asterisk marking the benign duct highlighted by p63 (e) and SMMHC (f) staining juxtaposed to carcinoma glands, absent of p63 and SMMHC staining at 100×
-
3.
Immunohistochemistry studies for differential diagnosis of ductal intraepithelial proliferations.
Ductal intraepithelial proliferations include the lesions usual ductal hyperplasia (UDH), atypical ductal hyperplasia (ADH), and ductal carcinoma in situ (DCIS) [8, 9]. Histologically, usual ductal hyperplasia can be described as an intraductal proliferation of cells with pleomorphic nuclei, haphazard arrangement, and irregular slit-like spaces or fenestrations. Frequently, the cells and nuclei show overlapping with rare to no mitoses. Conversely, with atypical ductal hyperplasia, cells begin to have monomorphic nuclei with nuclear enlargement and less cellular overlap and begin to show more regular, symmetrical fenestrations with possible cellular bridges (roman-arch bridges). In DCIS, the duct is filled with cells with monomorphic nuclei, without cellular overlap and with possible symmetrical fenestrations. This spectrum of lesions is suggested to be the precursor lesions for invasive ductal carcinoma, with increased gain of function mutations in cell proliferation genes, as well as increased loss-of-function mutations in cell cycle regulatory and apoptosis genes, paving a pathway to malignancy [10–12]. Consistent with this observation, the presence of UDH confers a 1.9 times relative risk of cancer development, ADH has a four to five times risk, and DCIS has an eight to ten times risk of cancer [13].
As a result, there are different approaches to clinical management where the detection of ADH or DCIS on biopsy requires obligate excision of the lesion. Therefore, effort has been placed on identifying molecular markers to help distinguish between UDH, ADH, and DCIS. Studies have demonstrated that the cytokeratin family of proteins, a type of intermediate filaments used for cell structural elements, are variably expressed in ductal proliferative lesions. High molecular weight cytokeratins (CK903 and CK5/6) have higher and diffuse expression in UDH compared to ADH/DCIS lesions with reduced staining [14–16]. Though this technique has improved the diagnostic agreement among pathologists [17], there is evidence that across the spectrum of progression from a hyperplastic lesion to in situ carcinomatous lesion, there is variability with respect to expression of CK5/6 and CK903 among ADH and DCIS lesions [18], suggesting that these cytokeratin combinations are most useful for distinguishing ADH and low-grade DCIS lesions from UDH. However, they are not applicable for studying high-grade DCIS, as CK5/6 may be expressed in some high grade DCIS type lesions.
-
4.
Ductal vs. lobular neoplasias.
There are several subtypes of invasive breast lesions (including tubular, mucinous, micropapillary, papillary, cribriform, and medullary), where the most clinically significant patterns include ductal and lobular patterns since these two entities compromise most of the breast lesions encountered on a daily basis [8]. At the level of precursor lesions (DCIS and lobular neoplasia), lobular neoplasias, which include atypical lobular hyperplasia (ALH) and lobular carcinoma in situ (LCIS), are histologically different in appearance to ductal lesions [19]. Although these cells are monomorphic, with large nuclei and do not overlap in a similar fashion to atypical ductal proliferations, they have a more discohesive appearance [19]. These cells can fill the acini of the lobules without expansion (as in ALH), with expansion in a lobular pattern (as in LCIS), and involve the ducts described as pagetoid spread [19].
Even though lobular neoplasias are associated with invasive cancers (more so with invasive lobular carcinoma), there has been debate as to whether they are precursor lesions for invasive carcinoma [20]. Lobular lesions, when compared to ductal-type lesions, display different clinicopathological behaviors. The presence of lobular neoplasias is associated with increased diffuse disease and involvement of the bilateral breasts [21–23]. However, in terms of the presence of noninvasive lobular neoplasias at specimen margins, the cancer recurrence rate in patients with positive margins is comparable to the rate in patients with negative margins [24]. Therefore, unlike the management of DCIS, lobular neoplasias (ALH and LCIS) at specimen margins do not require re-excision.
Invasive lobular carcinomas (ILCs) and invasive ductal carcinomas (IDCs) also demonstrate different clinical behavior. Though the rate of lymph node metastasis is similar to that of invasive ductal carcinomas, invasive lobular carcinomas tend to metastasize to the skin and visceral organs, whereas invasive ductal carcinomas tend to metastasize to the lungs [25, 26]. However, some clinical differences are debatable. For instance, one study showed patients with invasive lobular carcinomas have similar prognosis to those with invasive ductal carcinomas [27]. Conversely, another study showed using multivariate analysis that patients with ILC had worse survival than patients with IDC [25]. Nevertheless, distinguishing lobular from ductal-type lesions is of clinical consequence. To that end, molecular markers to distinguish these two histotypes have been identified.
Consistent with the discohesive cellular morphology of lobular-type neoplasias, it has been demonstrated that the cell adhesion signaling pathway mediated by E-cadherin , p120 catenin, and β-catenin is altered in these lesions [28]. E-cadherin is a transmembrane cell adhesion molecule that interacts with intracellular proteins of the catenin family (p120, α and β-catenin) that associates with actin and other cytoskeletal elements to regulate cell integrity and cell proliferation [29, 30]. Immunohistochemical analysis of these proteins in normal tissue shows strong membranous localization for E-cadherin and p120, and membranous staining for β-catenin [29, 31]. Somatic mutations, genetic deletions, loss of heterozygosity, and epigenetic changes that silence the expression of the gene that encodes for E-cadherin (CDH1) have been routinely detected in lobular neoplasias [32, 33]. As a result, immunohistochemistry of lobular-type lesions for E-cadherin shows a reduction in protein expression [34]. In conjunction with these perturbations, there is a shift in p120 localization from the cell membrane to the cytoplasm with scant cytoplasmic β-catenin expression [31, 35]. In our laboratory, E-cadherin IHC staining is routinely used to differentiate the two lesions (Fig. 2), and has been a very useful tool in classifying histologically ambiguous lesions.
Fig. 2 
E-cadherin (clone 36) immunohistochemical analysis distinguishing ductal from lobular neoplasias. (a, b) at 200×. Hematoyxylin-eosin (H & E) staining of micropapillary ductal carcinoma in situ with pagetoid spread of (a) lobular carcinoma in situ (LCIS) with corresponding E-cadherin staining (b). Note the ductalFig. 2 (continued) proliferation highlighted by strong E-cadherin staining, with areas of lobular-type proliferation showing absent E-cadherin expression marked by arrows. (c) H & E and (d) E-cadherin immunohistochemistry of LCIS at 200×. (e) H & E and (f) E-cadherin Immunohistochemistry of pagetoid spread of lobular neoplasia at 100×. Note the lobular lesions beneath the ductal epithelium highlighted by E-cadherin staining
-
5.
Lymph-vascular invasion.
Lymph-vascular invasion (LVI) is an important prognostic parameter that is used to determine the risk of local recurrence and distant metastases [36, 37]. In patients without nodal involvement, the subset without lymph-vascular invasion has lower rates of future metastasis and increased disease-free and overall survival [37, 38]. Lymphatic invasion is routinely considered in therapeutic decision-making for patients with a borderline tumor size and negative lymph node status. There are four criteria used in the definition of lymph-vascular invasion derived from Rosen et al. [39]: (1) invasion must be detected outside the border of invasive carcinoma, (2) tumor emboli should not fit exactly within the confines of the enclosing space, (3) endothelial cells should line the confining space, and (4) lymphatics are found nearby to blood vessels. In situations where it is difficult to ascertain LVI histologically, immunohistochemical methods have been employed to highlight the endothelial cells of vascular and lymphatic spaces [40]. Vascular and lymphatic endothelial cells express CD31 and CD34, whereas lymphatic vascular cells express D2-40 and podoplanin [40, 41]. Using these markers to determine LVI, pathologists are able to increase the quantity and accuracy of detection of LVI in breast specimens [40, 41].
-
6.
Lymph node metastasis.
Metastasis to regional lymph nodes is associated with decreased disease-free and overall survival [42–44]. Pathological assessment of regional lymph nodes is key in staging a patient’s cancer [45]. Sentinel lymph nodes (SLNs) are the first series of lymph nodes that drain a particular region of the breast and have been observed to be the first type of lymph nodes that contain metastasis. Clinically, the SLNs are identified by highlighting them with intraoperative gamma radiotracer detected by a Geiger counter or visually detected blue-colored dye. Once highlighted as being “hot” and/or “blue,” a surgical biopsy is performed. An intraoperative assessment of SLNs can be performed on H & E slides of SLN frozen sections. If the SLNs are positive for metastatic tumor by frozen section evaluation, the practice for the surgeon in certain clinical situations is to perform an axillary dissection to obtain more axillary nodes. This would provide more accurate staging as positive SLNs correlate with axillary lymph node metastasis in a proportion of patients [46].
However, it has been demonstrated that there can be variability in diagnosing the presence and size of lymph node metastasis [47, 48]. Thus, measuring the size of metastasis or quantification of the number of cells is important in establishing prognosis and adjuvant treatment [48, 49]. Three main categories have been used: isolated tumor cells (≤0.2 mm or 200 cells), micrometastasis (more than 0.2 mm but ≤2.0 mm and/or ≥200 cells), and macrometastases (>2.0 mm). These categories correlate with nonsentinel axillary lymph node metastasis and prognosis [43, 46, 49]. To assist pathologists to this effect, IHC using the antibody combination AE1/AE3 for pancytokeratin expression found in breast tumor cells [50] has been widely used in determining lymph node metastasis, and size if applicable (Fig. 3) [43, 46, 48, 51].
Fig. 3 
Immunohistochemistry of sentinel lymph node for pancytokeratin revealing metastasis (isolated tumor cells) of Invasive Ductal Carcinoma. (a) Hematoxylin–eosin at 100×. Image of pancytokeratin staining (clone AE1/AE3/PCK26) of sentinel lymph node at 100× (b), and at 200× (c)
-
7.
Determination of breast metastasis from neoplasms of uncertain origins.
When metastatic lesions of unknown origin are encountered, it is prudent to include metastatic breast cancer as a major differential among possible sources, especially in female patients. Lineage-specific expression of proteins is useful in classifying metastasis by tissue of origin [52]. To help differentiate among various origins of cancer, a panel of IHC studies can be employed. As the majority of metastatic breast cancers are epithelial in origin, AE1/AE3 pancytokeratin antibodies are useful to validate epithelial differentiation. CK7 and CK20 stains are also performed as breast lesions are mostly CK7+ and CK20−, and this combination can distinguish them from other cell lineages such as colon and urothelial. To further distinguish from other CK7+/CK20− tumors such as nonmucinous lung adenocarcinomas, other combinations of mammary specific markers such as GATA3, estrogen receptor (ER) , gross cystic disease fluid protein 15 (GCDFP-15), and mammaglobin can also be utilized (Fig. 4).
Fig. 4 
Immunohistochemical determination of tissue origin of metastasis . Hematoxylin–eosin (H & E) staining at 100× (a) of metastatic breast lobular carcinoma located in small bowel submucosa. (b) Pancytokeratin immunostaining at 100× highlighting the benign small bowel epithelium (bottom half), and the submucosal metastatic breast lesion (top half). CDX2 (c), and E-cadherin (d) immunohistochemistry at 100× with positive staining of the small bowel epithelium (bottom half) and negative staining of the lobular breast lesion (top half). (e) GATA3 immunohistochemistry at 100× showing positive nuclear staining of the metastatic breast lesion (upper right). The cells stained in the lower left are lymphocytes within the small bowel lamina propria. (f) Mammaglobin immunohistochemistry at 100× showing positive cytoplasmic staining of the metastatic breast lesion (top right), as well as infiltrating breast carcinoma cells within the small bowel mucosa (lower left)
-
8.
Predictive and prognostic molecular factors and subclassification.
Estrogen is the primary hormone that regulates the proliferation of breast cancer cells through the interaction with its receptor, ER [53]. There are two known isoforms of ER, designated as ER-α and ER-β, where ER-α is the dominant regulator of estrogen signaling in breast cancer pathogenesis. ER expression is a strong predictive factor in terms of determining the potential benefits from adjuvant hormonal therapy.
Progesterone receptor (PR) is a superfamily of nuclear receptors, where a single copy of the PR gene has separate promoters and translational start sites to produce two isoforms, PR-α and PR-β [54]. PR is also considered important in cancer pathogenesis as PR is the codependent partner of ER in terms of the biological behavior of breast cancer at the molecular level, since the interaction of progesterone and PR is an essential component of physiology.
Human Epidermal Growth Factor Receptor 2 (HER2) , expressed by the gene ERBB2, is a member of a family of transmembrane growth factor receptors that play pivotal roles in regulating normal cell proliferation and transmitting signals for cell growth and survival [55]. The HER2 receptor tyrosine kinase plays a very important role in both the biological behavior and the clinical course of breast cancer. Although the identity of the high-affinity ligand for HER2 remains unclear, HER2 is thought to dimerize with other HER receptors within the family, leading to activation of cytoplasmic tyrosine kinase thus initiating downstream signaling for cell proliferation, migration , and survival of tumor cells overexpressing HER receptors. When the HER2 receptor tyrosine kinase is activated, multiple cellular signaling pathways are initiated that include both the mitogen-activated protein kinase (MAPK) and phosphatidylinositol 3-kinase (PI3K) signaling pathways. Normally, cells contain a single copy of the HER2 gene on each copy of chromosome 17 [56]. Breast epithelial cells express the HER2 gene, which is translated into a 185 kDa transmembrane growth factor receptor with cytoplasmic tyrosine kinase activity. HER2 genes can be amplified from twofold to greater than 20-fold in each tumor cell nucleus relative to chromosome 17 in approximately 15–25 % of breast cancer cases, resulting in the expression of cell surface HER2 receptors with up to 100 times the normal number of receptors found in normal breast epithelial cells.
Based on gene expression profiling from cDNA microarray analysis of clinically-acquired breast lesions, subgroup classifications with associated biological and clinical behaviors can be determined by similar expression of ER , PR , and HER2 [57]. A first group was described as having a transcriptome profile similar to luminal cells with expression of the hormone receptors ER and PR . A second group demonstrated high expression of the ERBB2 coding for the HER2. A third was demonstrated to have an expression profile similar to basal cells with triple negative expression of ER, PR , and HER2 . And a fourth group was described as having an expression profile close to that of normal breast tissue. It was subsequently demonstrated that luminal and basal subtypes could be further divided. In the luminal subgroup, a portion of tumors co-express HER2, thus generating the subtype luminal A (ER+/HER2−) and luminal B (ER+/HER2+) [58, 59]. Furthermore, based on the expression of cytokeratin CK5/6 and the Epidermal Growth Factor receptor 1 (EGFR), the basal-type triple negative subgroup could be further divided into two groups that co-express or lack expression of these proteins [60, 61].
Altogether, four major subclasses are clinically recognized: Luminal A (ER+ HER2−), Luminal B (ER+ HER2+), HER2 (ER− HER2+), and Triple Negative (TNC) (ER− PR− HER−; CK5/6±, EGFR±). Assays based on qRT-PCR methods for measuring the gene expression of select genes including ER , PR , and HER2 simulate the early cDNA gene array profiling studies, and can be performed for clinical prognostication by classifying the various breast subtypes [62, 63]. However, a more economic form of breast subtype classification can be performed via IHC-based methods staining for the ER , PR and HER2 combinations [60] (Fig. 5).
Fig. 5 
Molecular subtyping of breast invasive carcinoma. Hematoxylin–eosin (H & E) , and immunohistochemistry of ER (clone SP1) and HER2 (clone 4B5) at 200×, classifying Luminal A (a, H & E; b, ER; c, HER2), Luminal B (d, H & E; e, ER; f, HER2), HER2 (g, H & E; h, ER; i, HER2), and Triple negative cancer (j, H & E; k, ER; l, HER2) subgroups. PR staining not shown
Molecular-derived classification has displayed a hierarchy of particular clinical behaviors. TNCs and HER2 subgroups have been demonstrated to have worse overall survival compared to the luminal subgroups [64–66]. TNCs have the highest mitotic activity, followed by HER2, luminal B, and luminal A group cancers in descending order [61, 64]. HER2 subgroup cancers are associated with the highest rate of lymph node metastases, followed by luminal B, TNC, and luminal A lesions [64].
-
9.
Scoring systems for ER, PR, and HER2 expression by IHC.
The quantity of biomarker expression, based on molecular classification of the breast cancers, governs clinical management. Luminal cancers, with their higher level of expression of ER and ER-related genes, are considered for hormonal-based therapy such as adjuvant tamoxifen or aromatase inhibitors as a main stay for therapeutic intervention. Interestingly, luminal subgroups show differential response to anti-hormonal therapy [62]. Luminal A cancers have a higher response to hormonal-based therapy compared to luminal B cancers, perhaps in part to its dual HER2 expression. Conversely, luminal B cancers show increased susceptibility to anthracycline-based chemotherapy [67]. Similarly, in the HER2 subgroup, clinical treatment is based on targeting HER2 overexpression by combination of adjuvant chemotherapy and anti-HER2 antibodies, like Trastuzumab, with increased clinical benefit over adjuvant chemotherapy alone [68, 69]. With respect to TNCs, patients within this subgroup have been shown to gain benefit in disease-free and overall survival from neoadjuvant anthracycline-based chemotherapy [70, 71], as well as high-dose adjuvant chemotherapy compared to conventional doses of chemotherapy [72]. Therefore, a standardized protocol for quantifying IHC staining is important to determining positivity of biomarker expression as it strongly influences clinical management.
In daily practice, the presence of ER and PR in breast tissue is measured on formalin-fixed and paraffin-embedded (FFPE) breast tissue containing the maximal amount of viable tumor cells. IHC analysis of hormone receptor expression has been described as a more superior detection compared to previously utilized ligand binding methods [73, 74]. Increased levels of ER and PR expression by IHC correlate with response to anti-hormonal therapies [74, 75]. However, other studies have shown that tumors with even 1 % of nuclei showing nuclear expression of hormone receptor can respond to hormonal therapy [76]. Based on these observations, a consensus was reached by the American Society of Clinical Oncology (ASCO) and the College of American Pathologists (CAP) on testing interpretation criteria that include the definition of positive and negative status for hormone receptor by IHC studies and the reporting of these corresponding results [76, 77], where any nuclear immunoreactivity ≥1 % be reported as “positive” along with average intensity and extent of staining.
ASCO and CAP also recommend that HER-2 status can be determined by IHC for protein overexpression [78]. Therefore, all newly diagnosed breast cancer cases are tested for the HER-2 molecular marker using FFPE tissue sections of invasive breast cancer. Evaluations of breast cancer cell membrane HER2 protein expression by IHC are semi-quantitatively reported in pathology reports, where an absence of membranous staining or incomplete, faint membranous staining in ≤10 % of invasive tumor cells is scored as ‘0’, incomplete, faint membranous staining in >10 % of invasive tumor cells is scored as ‘1+’, incomplete and/or weak circumferential membrane staining in >10 % of invasive tumor cells or complete, intense, circumferential membranous staining in ≤10 % of invasive tumor cells is scored as ‘2+’, and circumferential membranous staining of at least 10 % of the tumor cells with a thick staining ring and refractile quality is scored as ‘3+’ (Fig. 6). Only cases with strong circumferential membrane staining, scored as “3+,” show clinically relevant concordance with HER2 gene amplification by FISH . The HER2+ breast cancers that are IHC 3+ by IHC staining are candidates for targeted Trastuzumab treatment that will provide the most benefit to patients [79].
Fig. 6 
Grading of HER2 immunohistochemistry staining of invasive carcinoma (clone 4B5) at 200×. (a) Hematoxylin–eosin (H & E) and corresponding HER2 immunohistochemistry (b) showing absence of membranousFig. 6 (continued) staining, grade “0”—Negative. (c) H & E and corresponding HER2 immunohistochemistry (d) showing faint, incomplete membranous staining of >10 % tumor cells, grade “1”—Negative. (e) H & E and (f) and corresponding HER2 immunohistochemistry with weak to moderate, incomplete, circumferential staining of >10 % tumor cells, grade “2”—Equivocal. (g) H & E and corresponding HER2 immunohistochemistry (h) with strong, complete circumferential membranous staining, grade “3”—Positive
-
10.
Ki-67 coupling histopathologic and molecular factors to predict prognosis and treatment.
Pathologists generally use the Nottingham Combined Histologic Grade for standardized grading for breast tumors [80]. This overall grading methodology is based on the sum of the individual assessments of the degree of tubular formation, nuclear pleomorphism, and mitotic activity, where the combined score puts the tumor in a tiered system that characterizes the tumor as either low-, intermediate-, or high-grade. Even though grading is qualitative and dependent on observer variability, histologic grade is still an important parameter in terms of predicting clinical outcome [81–83]. Of the grading schema, cell proliferation has gained particular attention as it can be used to further differentiate cancer groups into high and low categories and influencing prognosis [84, 85]. And even though increased cell proliferation is associated with poor prognosis, it predicts increased response to certain chemotherapeutic treatments [70, 71, 84]. Therefore, Ki-67 has become the surrogate marker for cell proliferation as it is increasingly and specifically expressed in the nuclei of all stages of active cellular division except G0 and early G1 [86].
To assist in quantification of cell proliferation, IHC staining for Ki-67 is routinely used in assessing cancers, coupling the histological grading system to the molecular-based subgroups of breast cancer [85]. Recently, the International Ki-67 in Breast Cancer Working Group generated recommendations for the application of Ki-67 staining and quantitative scoring in breast cancers. Cells suitable for scoring should have complete nuclear expression, suggestive of good specimen quality (Fig. 7). For a quantitative measurement of Ki-67 expression, at least three fields of cells at 40× objective located at the tumor’s invasive edge should be analyzed. However, if there are heterogeneous regions of Ki-67 expression throughout the lesion, described as “hot spots,” an overall average of the Ki-67 expression should be calculated [85].
Fig. 7 
Cell proliferation by Ki-67 immunohistochemistry at 400×. Nuclear staining of carcinoma cells by Ki-67 (clone 30-9) immunohistochemistry with various quantities of expression. (a) 10–15 %, (b) 35–40 %, (c) 60–65 %, (d) >90 % of tumor cells present are positive for Ki-67 nuclear staining.
Scoring of Ki-67 expression also has a predictive role in treatment of breast cancers. In luminal cancers, increased Ki-67 expression was detected in the luminal B subgroup, and can be used to differentiate from the luminal A subgroup with a cutoff point of 13.25 % [84]. This has been illustrated in the IMPACT and the P024 clinical trials, where expression of Ki-67 status post neoadjuvant chemotherapy with combined hormonal and anthracycline-based therapy has a linear correlation with recurrence [87, 88]. These findings have been supported by other studies showing increased Ki-67 expression associated with increased complete pathological response to anthracycline-based neoadjuvant chemotherapy [70, 71, 84]. This observation is crucial with the clinical management of the triple negative cancer (TNC) subgroup, since these lesions have been demonstrated to have high-grade disease and high Ki-67 expression with poor clinical outcomes [61, 70, 71, 84 ].
-
11.
Quality assurance of breast specimens for accurate assessment of biomarker expression.
Proper handling and care of breast specimens is necessary for accurate quantification and assessment of biomarker expression by IHC. Once the breast specimen is removed from the patient, the length of time before placement in formalin, known as the cold ischemic time, is a key factor in affecting integrity of biomarker expression. It has been demonstrated that refrigerated specimens with cold ischemic times over 4 h and unrefrigerated specimens with cold ischemic times over 2 h begin to show drastic decreases in ER, PR, and HER2 expression [89]. This has led to the ASCP/CAP recommendation of keeping ischemic times no longer than 1 h [76, 89]. Formalin times are another important factor in maintaining quality of biomarker expression. Formalin times below 6 h have been documented to decrease detectable expression of ER , PR , and HER2 [90]. Conversely, formalin times greater than 72 h also result in decreased expression for ER , PR , and HER2 expression [91–93]. Combining these observations with quality assurance of immunohistochemistry results for ER , PR , HER2 , and Ki-67 have led to established CAP/ASCO guidelines that have recommended that specimens must be incubated in formalin no less than 6 h and no more than 72 h [76, 78, 85].
As a result of rapidly advancing biotechnologies, especially that of gene expression studies, our knowledge of breast pathology has been greatly expanded. With this enhanced knowledge, we have implemented the use of immunohistochemical analysis of diagnostic and predictive markers as an invaluable tool in modern clinical practice to help determine both the clinical management of breast disease and to improve overall patient care. In this chapter, we have discussed the ways in which IHC analysis can enhance H & E examinations to further distinguish benign from malignant breast lesions, differentiate subtypes of breast neoplasias, and to quantify cancer cells and biomarker expression to support various clinical interventions. With the ongoing work into the discovery and development of better prognostic biomarkers, this invaluable tool will ultimately be refined, to the benefit of pathologists, clinicians, and most importantly, our patients.


References
Collins LC, Schnitt SJ (2007) Histology for pathologists. Lippincott Williams & Wilkins, Philadelphia
Bocker W, Bier B, Freytag G, Brommelkamp B, Jarasch ED, Edel G, Dockhorn-Dworniczak B, Schmid KW (1992) An immunohistochemical study of the breast using antibodies to basal and luminal keratins, alpha-smooth muscle actin, vimentin, collagen IV and laminin. Part II: epitheliosis and ductal carcinoma in situ. Virchows Arch A Pathol Anat Histopathol 421(4):323–330
Jarasch ED, Nagle RB, Kaufmann M, Maurer C, Bocker WJ (1988) Differential diagnosis of benign epithelial proliferations and carcinomas of the breast using antibodies to cytokeratins. Hum Pathol 19(3):276–289
Egan MJ, Newman J, Crocker J, Collard M (1987) Immunohistochemical localization of S100 protein in benign and malignant conditions of the breast. Arch Pathol Lab Med 111(1):28–31
Werling RW, Hwang H, Yaziji H, Gown AM (2003) Immunohistochemical distinction of invasive from noninvasive breast lesions: a comparative study of p63 versus calponin and smooth muscle myosin heavy chain. Am J Surg Pathol 27(1):82–90
Barbareschi M, Pecciarini L, Cangi MG, Macri E, Rizzo A, Viale G, Doglioni C (2001) p63, a p53 homologue, is a selective nuclear marker of myoepithelial cells of the human breast. Am J Surg Pathol 25(8):1054–1060
Damiani S, Ludvikova M, Tomasic G, Bianchi S, Gown AM, Eusebi V (1999) Myoepithelial cells and basal lamina in poorly differentiated in situ duct carcinoma of the breast. An immunocytochemical study. Virchows Arch 434(3):227–234
Lakhani S, Ellis I, Schnitt S (2012) WHO classification of tumours of the breast. IARC Press, Lyon
Tavassoli F, Devilee P (eds) (2003) Pathology and genetics of tumours of the breast and female genital organs. IARC Press, Lyon
Mommers EC, Poulin N, Sangulin J, Meijer CJ, Baak JP, van Diest PJ (2001) Nuclear cytometric changes in breast carcinogenesis. J Pathol 193(1):33–39. doi:10.1002/1096-9896(2000)9999:9999<::AID-PATH744>3.0.CO;2-Q
Mommers EC, van Diest PJ, Leonhart AM, Meijer CJ, Baak JP (1998) Expression of proliferation and apoptosis-related proteins in usual ductal hyperplasia of the breast. Hum Pathol 29(12):1539–1545
Mommers EC, van Diest PJ, Leonhart AM, Meijer CJ, Baak JP (1999) Balance of cell proliferation and apoptosis in breast carcinogenesis. Breast Cancer Res Treat 58(2):163–169
Dupont WD, Page DL (1985) Risk factors for breast cancer in women with proliferative breast disease. N Engl J Med 312(3):146–151. doi:10.1056/NEJM198501173120303
Moinfar F, Man YG, Lininger RA, Bodian C, Tavassoli FA (1999) Use of keratin 35betaE12 as an adjunct in the diagnosis of mammary intraepithelial neoplasia-ductal type – benign and malignant intraductal proliferations. Am J Surg Pathol 23(9):1048–1058
Otterbach F, Bankfalvi A, Bergner S, Decker T, Krech R, Boecker W (2000) Cytokeratin 5/6 immunohistochemistry assists the differential diagnosis of atypical proliferations of the breast. Histopathology 37(3):232–240
Boecker W, Moll R, Dervan P, Buerger H, Poremba C, Diallo RI, Herbst H, Schmidt A, Lerch MM, Buchwalow IB (2002) Usual ductal hyperplasia of the breast is a committed stem (progenitor) cell lesion distinct from atypical ductal hyperplasia and ductal carcinoma in situ. J Pathol 198(4):458–467. doi:10.1002/path.1241
Jain RK, Mehta R, Dimitrov R, Larsson LG, Musto PM, Hodges KB, Ulbright TM, Hattab EM, Agaram N, Idrees MT, Badve S (2011) Atypical ductal hyperplasia: interobserver and intraobserver variability. Mod Pathol 24(7):917–923. doi:10.1038/modpathol.2011.66
Lacroix-Triki M, Mery E, Voigt JJ, Istier L, Rochaix P (2003) Value of cytokeratin 5/6 immunostaining using D5/16 B4 antibody in the spectrum of proliferative intraepithelial lesions of the breast. A comparative study with 34betaE12 antibody. Virchows Arch 442(6):548–554. doi:10.1007/s00428-003-0808-0
Haagensen CD, Lane N, Lattes R, Bodian C (1978) Lobular neoplasia (so-called lobular carcinoma in situ) of the breast. Cancer 42(2):737–769
Jorns J, Sabel MS, Pang JC (2014) Lobular neoplasia: morphology and management. Arch Pathol Lab Med 138(10):1344–1349. doi:10.5858/arpa.2014-0278-CC
Chuba PJ, Hamre MR, Yap J, Severson RK, Lucas D, Shamsa F, Aref A (2005) Bilateral risk for subsequent breast cancer after lobular carcinoma-in-situ: analysis of surveillance, epidemiology, and end results data. J Clin Oncol 23(24):5534–5541. doi:10.1200/JCO.2005.04.038
Zengel B, Yararbas U, Duran A, Uslu A, Eliyatkin N, Demirkiran MA, Cengiz F, Simsek C, Postaci H, Vardar E, Durusoy R (2013) Comparison of the clinicopathological features of invasive ductal, invasive lobular, and mixed (invasive ductal + invasive lobular) carcinoma of the breast. Breast Cancer. doi:10.1007/s12282-013-0489-8
Hofmeyer S, Pekar G, Gere M, Tarjan M, Hellberg D, Tot T (2012) Comparison of the subgross distribution of the lesions in invasive ductal and lobular carcinomas of the breast: a large-format histology study. Int J Breast Cancer 2012:436141. doi:10.1155/2012/436141
Ciocca RM, Li T, Freedman GM, Morrow M (2008) Presence of lobular carcinoma in situ does not increase local recurrence in patients treated with breast-conserving therapy. Ann Surg Oncol 15(8):2263–2271. doi:10.1245/s10434-008-9960-8
Korhonen T, Kuukasjarvi T, Huhtala H, Alarmo EL, Holli K, Kallioniemi A, Pylkkanen L (2013) The impact of lobular and ductal breast cancer histology on the metastatic behavior and long term survival of breast cancer patients. Breast 22(6):1119–1124. doi:10.1016/j.breast.2013.06.001
Ferlicot S, Vincent-Salomon A, Medioni J, Genin P, Rosty C, Sigal-Zafrani B, Freneaux P, Jouve M, Thiery JP, Sastre-Garau X (2004) Wide metastatic spreading in infiltrating lobular carcinoma of the breast. Eur J Cancer 40(3):336–341
Arpino G, Bardou VJ, Clark GM, Elledge RM (2004) Infiltrating lobular carcinoma of the breast: tumor characteristics and clinical outcome. Breast Cancer Res 6(3):R149–R156. doi:10.1186/bcr767
Chan JK, Wong CS (2001) Loss of E-cadherin is the fundamental defect in diffuse-type gastric carcinoma and infiltrating lobular carcinoma of the breast. Adv Anat Pathol 8(3):165–172
Ohkubo T, Ozawa M (1999) p120(ctn) binds to the membrane-proximal region of the E-cadherin cytoplasmic domain and is involved in modulation of adhesion activity. J Biol Chem 274(30):21409–21415
Nelson WJ, Nusse R (2004) Convergence of Wnt, beta-catenin, and cadherin pathways. Science 303(5663):1483–1487. doi:10.1126/science.1094291
Dabbs DJ, Kaplai M, Chivukula M, Kanbour A, Kanbour-Shakir A, Carter GJ (2007) The spectrum of morphomolecular abnormalities of the E-cadherin/catenin complex in pleomorphic lobular carcinoma of the breast. Appl Immunohistochem Mol Morphol 15(3):260–266. doi:10.1097/01.pai.0000213128.78665.3c
Lerwill MF (2006) The evolution of lobular neoplasia. Adv Anat Pathol 13(4):157–165
Mastracci TL, Tjan S, Bane AL, O’Malley FP, Andrulis IL (2005) E-cadherin alterations in atypical lobular hyperplasia and lobular carcinoma in situ of the breast. Mod Pathol 18(6):741–751. doi:10.1038/modpathol.3800362
Handschuh G, Candidus S, Luber B, Reich U, Schott C, Oswald S, Becke H, Hutzler P, Birchmeier W, Hofler H, Becker KF (1999) Tumour-associated E-cadherin mutations alter cellular morphology, decrease cellular adhesion and increase cellular motility. Oncogene 18(30):4301–4312. doi:10.1038/sj.onc.1202790
Sarrio D, Perez-Mies B, Hardisson D, Moreno-Bueno G, Suarez A, Cano A, Martin-Perez J, Gamallo C, Palacios J (2004) Cytoplasmic localization of p120ctn and E-cadherin loss characterize lobular breast carcinoma from preinvasive to metastatic lesions. Oncogene 23(19):3272–3283. doi:10.1038/sj.onc.1207439
Davis BW, Gelber R, Goldhirsch A, Hartmann WH, Hollaway L, Russell I, Rudenstam CM (1985) Prognostic significance of peritumoral vessel invasion in clinical trials of adjuvant therapy for breast cancer with axillary lymph node metastasis. Hum Pathol 16(12):1212–1218
Lauria R, Perrone F, Carlomagno C, De Laurentiis M, Morabito A, Gallo C, Varriale E, Pettinato G, Panico L, Petrella G et al (1995) The prognostic value of lymphatic and blood vessel invasion in operable breast cancer. Cancer 76(10):1772–1778
Colleoni M, Rotmensz N, Peruzzotti G, Maisonneuve P, Mazzarol G, Pruneri G, Luini A, Intra M, Veronesi P, Galimberti V, Torrisi R, Cardillo A, Goldhirsch A, Viale G (2005) Size of breast cancer metastases in axillary lymph nodes: clinical relevance of minimal lymph node involvement. J Clin Oncol 23(7):1379–1389. doi:10.1200/JCO.2005.07.094
Rosen PP (1983) Tumor emboli in intramammary lymphatics in breast carcinoma: pathologic criteria for diagnosis and clinical significance. Pathol Annu 18(Pt 2):215–232
Van den Eynden GG, Van der Auwera I, Van Laere SJ, Colpaert CG, van Dam P, Dirix LY, Vermeulen PB, Van Marck EA (2006) Distinguishing blood and lymph vessel invasion in breast cancer: a prospective immunohistochemical study. Br J Cancer 94(11):1643–1649. doi:10.1038/sj.bjc.6603152
Mohammed RA, Martin SG, Gill MS, Green AR, Paish EC, Ellis IO (2007) Improved methods of detection of lymphovascular invasion demonstrate that it is the predominant method of vascular invasion in breast cancer and has important clinical consequences. Am J Surg Pathol 31(12):1825–1833. doi:10.1097/PAS.0b013e31806841f6
Treseler P (2006) Pathologic examination of the sentinel lymph node: what is the best method? Breast J 12(5 Suppl 2):S143–S151. doi:10.1111/j.1075-122X.2006.00328.x
Nasser IA, Lee AK, Bosari S, Saganich R, Heatley G, Silverman ML (1993) Occult axillary lymph node metastases in “node-negative” breast carcinoma. Hum Pathol 24(9):950–957
Mullenix PS, Brown TA, Meyers MO, Giles LR, Sigurdson ER, Boraas MC, Hoffman JP, Eisenberg BL, Torosian MH (2005) The association of cytokeratin-only-positive sentinel lymph nodes and subsequent metastases in breast cancer. Am J Surg 189(5):606–609. doi:10.1016/j.amjsurg.2005.01.031, discussion 609
Connolly JL (2006) Changes and problematic areas in interpretation of the AJCC Cancer Staging Manual, 6th Edition, for breast cancer. Arch Pathol Lab Med 130(3):287–291. doi:10.1043/1543-2165(2006)130[287:CAPAII]2.0.CO;2
Dabbs DJ, Fung M, Landsittel D, McManus K, Johnson R (2004) Sentinel lymph node micrometastasis as a predictor of axillary tumor burden. Breast J 10(2):101–105
Carcoforo P, Bergossi L, Basaglia E, Soliani G, Querzoli P, Zambrini E, Pozza E, Feggi L (2002) Prognostic and therapeutic impact of sentinel node micrometastasis in patients with invasive breast cancer. Tumori 88(3):S4–S5
Tan LK, Giri D, Hummer AJ, Panageas KS, Brogi E, Norton L, Hudis C, Borgen PI, Cody HS 3rd (2008) Occult axillary node metastases in breast cancer are prognostically significant: results in 368 node-negative patients with 20-year follow-up. J Clin Oncol 26(11):1803–1809. doi:10.1200/JCO.2007.12.6425
Kahn HJ, Hanna WM, Chapman JA, Trudeau ME, Lickley HL, Mobbs BG, Murray D, Pritchard KI, Sawka CA, McCready DR, Marks A (2006) Biological significance of occult micrometastases in histologically negative axillary lymph nodes in breast cancer patients using the recent American Joint Committee on Cancer breast cancer staging system. Breast J 12(4):294–301. doi:10.1111/j.1075-122X.2006.00267.x
Czerniecki BJ, Scheff AM, Callans LS, Spitz FR, Bedrosian I, Conant EF, Orel SG, Berlin J, Helsabeck C, Fraker DL, Reynolds C (1999) Immunohistochemistry with pancytokeratins improves the sensitivity of sentinel lymph node biopsy in patients with breast carcinoma. Cancer 85(5):1098–1103
Clare SE, Sener SF, Wilkens W, Goldschmidt R, Merkel D, Winchester DJ (1997) Prognostic significance of occult lymph node metastases in node-negative breast cancer. Ann Surg Oncol 4(6):447–451
Lin F, Liu H (2014) Immunohistochemistry in undifferentiated neoplasm/tumor of uncertain origin. Arch Pathol Lab Med 138(12):1583–1610. doi:10.5858/arpa.2014-0061-RA
Deroo BJ, Korach KS (2006) Estrogen receptors and human disease. J Clin Invest 116(3):561–570. doi:10.1172/JCI27987
Jacobsen BM, Horwitz KB (2012) Progesterone receptors, their isoforms and progesterone regulated transcription. Mol Cell Endocrinol 357(1–2):18–29. doi:10.1016/j.mce.2011.09.016
Harari D, Yarden Y (2000) Molecular mechanisms underlying ErbB2/HER2 action in breast cancer. Oncogene 19(53):6102–6114. doi:10.1038/sj.onc.1203973
Shah SS, Wang Y, Tull J, Zhang S (2009) Effect of high copy number of HER2 associated with polysomy 17 on HER2 protein expression in invasive breast carcinoma. Diagn Mol Pathol 18(1):30–33. doi:10.1097/PDM.0b013e31817c1af8
Perou CM, Sorlie T, Eisen MB, van de Rijn M, Jeffrey SS, Rees CA, Pollack JR, Ross DT, Johnsen H, Akslen LA, Fluge O, Pergamenschikov A, Williams C, Zhu SX, Lonning PE, Borresen-Dale AL, Brown PO, Botstein D (2000) Molecular portraits of human breast tumours. Nature 406(6797):747–752. doi:10.1038/35021093
Sorlie T, Perou CM, Tibshirani R, Aas T, Geisler S, Johnsen H, Hastie T, Eisen MB, van de Rijn M, Jeffrey SS, Thorsen T, Quist H, Matese JC, Brown PO, Botstein D, Lonning PE, Borresen-Dale AL (2001) Gene expression patterns of breast carcinomas distinguish tumor subclasses with clinical implications. Proc Natl Acad Sci U S A 98(19):10869–10874. doi:10.1073/pnas.191367098
Sorlie T, Tibshirani R, Parker J, Hastie T, Marron JS, Nobel A, Deng S, Johnsen H, Pesich R, Geisler S, Demeter J, Perou CM, Lonning PE, Brown PO, Borresen-Dale AL, Botstein D (2003) Repeated observation of breast tumor subtypes in independent gene expression data sets. Proc Natl Acad Sci U S A 100(14):8418–8423. doi:10.1073/pnas.0932692100
Nielsen TO, Hsu FD, Jensen K, Cheang M, Karaca G, Hu Z, Hernandez-Boussard T, Livasy C, Cowan D, Dressler L, Akslen LA, Ragaz J, Gown AM, Gilks CB, van de Rijn M, Perou CM (2004) Immunohistochemical and clinical characterization of the basal-like subtype of invasive breast carcinoma. Clin Cancer Res 10(16):5367–5374. doi:10.1158/1078-0432.CCR-04-0220
Livasy CA, Karaca G, Nanda R, Tretiakova MS, Olopade OI, Moore DT, Perou CM (2006) Phenotypic evaluation of the basal-like subtype of invasive breast carcinoma. Mod Pathol 19(2):264–271. doi:10.1038/modpathol.3800528
Paik S, Shak S, Tang G, Kim C, Baker J, Cronin M, Baehner FL, Walker MG, Watson D, Park T, Hiller W, Fisher ER, Wickerham DL, Bryant J, Wolmark N (2004) A multigene assay to predict recurrence of tamoxifen-treated, node-negative breast cancer. N Engl J Med 351(27):2817–2826. doi:10.1056/NEJMoa041588
van de Vijver MJ, He YD, van’t Veer LJ, Dai H, Hart AA, Voskuil DW, Schreiber GJ, Peterse JL, Roberts C, Marton MJ, Parrish M, Atsma D, Witteveen A, Glas A, Delahaye L, van der Velde T, Bartelink H, Rodenhuis S, Rutgers ET, Friend SH, Bernards R (2002) A gene-expression signature as a predictor of survival in breast cancer. N Engl J Med 347(25):1999–2009. doi:10.1056/NEJMoa021967
Carey LA, Perou CM, Livasy CA, Dressler LG, Cowan D, Conway K, Karaca G, Troester MA, Tse CK, Edmiston S, Deming SL, Geradts J, Cheang MC, Nielsen TO, Moorman PG, Earp HS, Millikan RC (2006) Race, breast cancer subtypes, and survival in the Carolina Breast Cancer Study. JAMA 295(21):2492–2502. doi:10.1001/jama.295.21.2492
Rakha EA, El-Sayed ME, Green AR, Lee AH, Robertson JF, Ellis IO (2007) Prognostic markers in triple-negative breast cancer. Cancer 109(1):25–32. doi:10.1002/cncr.22381
Carey LA, Dees EC, Sawyer L, Gatti L, Moore DT, Collichio F, Ollila DW, Sartor CI, Graham ML, Perou CM (2007) The triple negative paradox: primary tumor chemosensitivity of breast cancer subtypes. Clin Cancer Res 13(8):2329–2334. doi:10.1158/1078-0432.CCR-06-1109
Parker JS, Mullins M, Cheang MC, Leung S, Voduc D, Vickery T, Davies S, Fauron C, He X, Hu Z, Quackenbush JF, Stijleman IJ, Palazzo J, Marron JS, Nobel AB, Mardis E, Nielsen TO, Ellis MJ, Perou CM, Bernard PS (2009) Supervised risk predictor of breast cancer based on intrinsic subtypes. J Clin Oncol 27(8):1160–1167. doi:10.1200/JCO.2008.18.1370
Slamon DJ, Leyland-Jones B, Shak S, Fuchs H, Paton V, Bajamonde A, Fleming T, Eiermann W, Wolter J, Pegram M, Baselga J, Norton L (2001) Use of chemotherapy plus a monoclonal antibody against HER2 for metastatic breast cancer that overexpresses HER2. N Engl J Med 344(11):783–792. doi:10.1056/NEJM200103153441101
Seidman AD, Berry D, Cirrincione C, Harris L, Muss H, Marcom PK, Gipson G, Burstein H, Lake D, Shapiro CL, Ungaro P, Norton L, Winer E, Hudis C (2008) Randomized phase III trial of weekly compared with every-3-weeks paclitaxel for metastatic breast cancer, with trastuzumab for all HER-2 overexpressors and random assignment to trastuzumab or not in HER-2 nonoverexpressors: final results of Cancer and Leukemia Group B protocol 9840. J Clin Oncol 26(10):1642–1649. doi:10.1200/JCO.2007.11.6699
Yoshioka T, Hosoda M, Yamamoto M, Taguchi K, Hatanaka KC, Takakuwa E, Hatanaka Y, Matsuno Y, Yamashita H (2013) Prognostic significance of pathologic complete response and Ki67 expression after neoadjuvant chemotherapy in breast cancer. Breast Cancer. doi:10.1007/s12282-013-0474-2
Horimoto Y, Arakawa A, Tanabe M, Sonoue H, Igari F, Senuma K, Tokuda E, Shimizu H, Kosaka T, Saito M (2014) Ki67 expression and the effect of neo-adjuvant chemotherapy on luminal HER2-negative breast cancer. BMC Cancer 14:550. doi:10.1186/1471-2407-14-550
Gluz O, Nitz UA, Harbeck N, Ting E, Kates R, Herr A, Lindemann W, Jackisch C, Berdel WE, Kirchner H, Metzner B, Werner F, Schutt G, Frick M, Poremba C, Diallo-Danebrock R, Mohrmann S, West German Study Group (2008) Triple-negative high-risk breast cancer derives particular benefit from dose intensification of adjuvant chemotherapy: results of WSG AM-01 trial. Ann Oncol 19(5):861–870. doi:10.1093/annonc/mdm551
Barnes DM, Harris WH, Smith P, Millis RR, Rubens RD (1996) Immunohistochemical determination of oestrogen receptor: comparison of different methods of assessment of staining and correlation with clinical outcome of breast cancer patients. Br J Cancer 74(9):1445–1451
Elledge RM, Green S, Pugh R, Allred DC, Clark GM, Hill J, Ravdin P, Martino S, Osborne CK (2000) Estrogen receptor (ER) and progesterone receptor (PgR), by ligand-binding assay compared with ER, PgR and pS2, by immuno-histochemistry in predicting response to tamoxifen in metastatic breast cancer: a Southwest Oncology Group Study. Int J Cancer 89(2):111–117
Stendahl M, Ryden L, Nordenskjold B, Jonsson PE, Landberg G, Jirstrom K (2006) High progesterone receptor expression correlates to the effect of adjuvant tamoxifen in premenopausal breast cancer patients. Clin Cancer Res 12(15):4614–4618. doi:10.1158/1078-0432.CCR-06-0248
Hammond ME, Hayes DF, Dowsett M, Allred DC, Hagerty KL, Badve S, Fitzgibbons PL, Francis G, Goldstein NS, Hayes M, Hicks DG, Lester S, Love R, Mangu PB, McShane L, Miller K, Osborne CK, Paik S, Perlmutter J, Rhodes A, Sasano H, Schwartz JN, Sweep FC, Taube S, Torlakovic EE, Valenstein P, Viale G, Visscher D, Wheeler T, Williams RB, Wittliff JL, Wolff AC (2010) American Society of Clinical Oncology/College of American Pathologists guideline recommendations for immunohistochemical testing of estrogen and progesterone receptors in breast cancer. Arch Pathol Lab Med 134(6):907–922. doi:10.1043/1543-2165-134.6.907
Harris L, Fritsche H, Mennel R, Norton L, Ravdin P, Taube S, Somerfield MR, Hayes DF, Bast RC Jr, American Society of Clinical Oncology (2007) American Society of Clinical Oncology 2007 update of recommendations for the use of tumor markers in breast cancer. J Clin Oncol 25(33):5287–5312. doi:10.1200/JCO.2007.14.2364
Wolff AC, Hammond ME, Hicks DG, Dowsett M, McShane LM, Allison KH, Allred DC, Bartlett JM, Bilous M, Fitzgibbons P, Hanna W, Jenkins RB, Mangu PB, Paik S, Perez EA, Press MF, Spears PA, Vance GH, Viale G, Hayes DF, American Society of Clinical Oncology; College of American Pathologists (2013) Recommendations for human epidermal growth factor receptor 2 testing in breast cancer: American Society of Clinical Oncology/College of American Pathologists clinical practice guideline update. J Clin Oncol 31(31):3997–4013. doi:10.1200/JCO.2013.50.9984
Menard S, Casalini P, Campiglio M, Pupa SM, Tagliabue E (2004) Role of HER2/neu in tumor progression and therapy. Cell Mol Life Sci 61(23):2965–2978. doi:10.1007/s00018-004-4277-7
Ellis IO, Elston CW (2006) Histologic grade. Elsevier, Philadelphia
Rakha EA, El-Sayed ME, Lee AH, Elston CW, Grainge MJ, Hodi Z, Blamey RW, Ellis IO (2008) Prognostic significance of Nottingham histologic grade in invasive breast carcinoma. J Clin Oncol 26(19):3153–3158. doi:10.1200/JCO.2007.15.5986
Harris GC, Denley HE, Pinder SE, Lee AH, Ellis IO, Elston CW, Evans A (2003) Correlation of histologic prognostic factors in core biopsies and therapeutic excisions of invasive breast carcinoma. Am J Surg Pathol 27(1):11–15
Pinder SE, Murray S, Ellis IO, Trihia H, Elston CW, Gelber RD, Goldhirsch A, Lindtner J, Cortes-Funes H, Simoncini E, Byrne MJ, Golouh R, Rudenstam CM, Castiglione-Gertsch M, Gusterson BA (1998) The importance of the histologic grade of invasive breast carcinoma and response to chemotherapy. Cancer 83(8):1529–1539
Cheang MC, Chia SK, Voduc D, Gao D, Leung S, Snider J, Watson M, Davies S, Bernard PS, Parker JS, Perou CM, Ellis MJ, Nielsen TO (2009) Ki67 index, HER2 status, and prognosis of patients with luminal B breast cancer. J Natl Cancer Inst 101(10):736–750. doi:10.1093/jnci/djp082
Dowsett M, Nielsen TO, A’Hern R, Bartlett J, Coombes RC, Cuzick J, Ellis M, Henry NL, Hugh JC, Lively T, McShane L, Paik S, Penault-Llorca F, Prudkin L, Regan M, Salter J, Sotiriou C, Smith IE, Viale G, Zujewski JA, Hayes DF, International Ki-67 in Breast Cancer Working Group (2011) Assessment of Ki67 in breast cancer: recommendations from the International Ki67 in Breast Cancer working group. J Natl Cancer Inst 103(22):1656–1664. doi:10.1093/jnci/djr393
Yu CC, Woods AL, Levison DA (1992) The assessment of cellular proliferation by immunohistochemistry: a review of currently available methods and their applications. Histochem J 24(3):121–131
Dowsett M, Smith IE, Ebbs SR, Dixon JM, Skene A, Griffith C, Boeddinghaus I, Salter J, Detre S, Hills M, Ashley S, Francis S, Walsh G, Trialists I (2005) Short-term changes in Ki-67 during neoadjuvant treatment of primary breast cancer with anastrozole or tamoxifen alone or combined correlate with recurrence-free survival. Clin Cancer Res 11(2 Pt 2):951s–958s
Ellis MJ, Coop A, Singh B, Tao Y, Llombart-Cussac A, Janicke F, Mauriac L, Quebe-Fehling E, Chaudri-Ross HA, Evans DB, Miller WR (2003) Letrozole inhibits tumor proliferation more effectively than tamoxifen independent of HER1/2 expression status. Cancer Res 63(19):6523–6531
Yildiz-Aktas IZ, Dabbs DJ, Bhargava R (2012) The effect of cold ischemic time on the immunohistochemical evaluation of estrogen receptor, progesterone receptor, and HER2 expression in invasive breast carcinoma. Mod Pathol 25(8):1098–1105. doi:10.1038/modpathol.2012.59
Kalkman S, Barentsz MW, van Diest PJ (2014) The effects of under 6 hours of formalin fixation on hormone receptor and HER2 expression in invasive breast cancer: a systematic review. Am J Clin Pathol 142(1):16–22. doi:10.1309/AJCP96YDQSTYBXWU
Arber DA (2002) Effect of prolonged formalin fixation on the immunohistochemical reactivity of breast markers. Appl Immunohistochem Mol Morphol 10(2):183–186
Oyama T, Ishikawa Y, Hayashi M, Arihiro K, Horiguchi J (2007) The effects of fixation, processing and evaluation criteria on immunohistochemical detection of hormone receptors in breast cancer. Breast Cancer 14(2):182–188
Tong LC, Nelson N, Tsourigiannis J, Mulligan AM (2011) The effect of prolonged fixation on the immunohistochemical evaluation of estrogen receptor, progesterone receptor, and HER2 expression in invasive breast cancer: a prospective study. Am J Surg Pathol 35(4):545–552. doi:10.1097/PAS.0b013e31820e6237
Acknowledgement
The authors would like to thank Ms. Laura Birney, Lucille Camille Kutcher, and Julie Elder of the Histology Laboratory at the Stony Brook University Hospital for their technical assistance.
Author information
Authors and Affiliations
Corresponding author
Editor information
Editors and Affiliations
Rights and permissions
Copyright information
© 2016 Springer Science+Business Media New York
About this protocol
Cite this protocol
Haye, K., Gupta, R., Metter, C., Liu, J. (2016). Clinical Applications for Immunohistochemistry of Breast Lesions. In: Cao, J. (eds) Breast Cancer. Methods in Molecular Biology, vol 1406. Humana Press, New York, NY. https://doi.org/10.1007/978-1-4939-3444-7_2
Download citation
DOI: https://doi.org/10.1007/978-1-4939-3444-7_2
Published:
Publisher Name: Humana Press, New York, NY
Print ISBN: 978-1-4939-3442-3
Online ISBN: 978-1-4939-3444-7
eBook Packages: Springer Protocols