
Abstract
The intrinsic features of retroelements, like their repetitive nature and disseminated presence in their host genomes, demand the use of advanced methodologies for their bioinformatic and functional study. The short length of SINE (short interspersed elements) retrotransposons makes such analyses even more complex. Next-generation sequencing (NGS) technologies are currently one of the most widely used tools to characterize the whole repertoire of gene expression in a specific tissue. In this chapter, we will review the molecular and computational methods needed to perform NGS analyses on SINE elements. We will also describe new methods of potential interest for researchers studying repetitive elements. We intend to outline the general ideas behind the computational analyses of NGS data obtained from SINE elements, and to stimulate other scientists to expand our current knowledge on SINE biology using RNA-seq and other NGS tools.
Access provided by CONRICYT – Journals CONACYT. Download protocol PDF
Key words
1 Introduction
Roughly 40 % of the human genome is composed of retrotransposons, including SINE (short interspersed elements ), LINE (long interspersed elements), and LTR (long terminal repeats ) elements [1]. These elements can increase their copy number in the host genome by a transposition mechanism that requires its own transcription to generate an intermediary RNA molecule that will be ultimately integrated into a different genomic location [2]. This amplification process might provoke important changes in the stability and function of the genome due to structural alterations and increased recombination and to the addition of genetic variability. Moreover, recent studies have shown that the expression of the genes in which those elements are located can be affected by several means including the activation of transcriptional enhancers or silencers [3, 4] and/or the generation of small non-coding RNAs (ncRNAs) involved in pre-mRNA processing [5, 6]. From an evolutionary perspective, it is generally accepted that the retroelements have contributed to the remodeling of the human transcriptional landscape by adding thousands of novel regulatory elements in the Primate lineage [7, 8].
SINEs are a group of retroelements between 100 and 500 base pairs (bp) in size [9]. An important subgroup within SINEs has been originated by the amplification of the 7SL RNA (signal recognition particle RNA) [10] and includes human Alus [11, 12] and murine B1 and B2 elements [13]. The RNA Pol III complex [14], which recognizes specific DNA sequences known as A- and B-boxes by the transcription factor s III-C (TFIIIC) and III-B (TFIIIB) and the catalytic subunit RPC32, normally transcribes these SINEs. Transcription starts upstream the A-box and continues along the SINE sequence until the presence of a stop signal composed by a repetition of at least four thymine residues [15]. As opposed to LINEs, SINEs do not code for any protein, and so their mobilization relies on the LINE machinery. For instance, it is known that SINE insertion sites are directed by LINE endonucleases [16], and that human Alus end in a poly-A sequence recognized by the LINE-1 reverse transcriptase [17].
Most copies of SINEs in the genome have been genetically inactivated by mutations that neutralize their promoter function, and only a small subgroup of those elements maintains its transcriptional capacity. For that, SINE -derived transcripts are generally hardly detected or even undetected in somatic tissues. An exception takes place during the maturation of spermatogonia and oocytes and in early stage embryo development, in which SINE transcription is allowed. Actually, germ cells can be depicted as a battlefield between retrotransposons and the host genome, in which novel DNA insertions, potentially deleterious, might be transmitted to a new generation. Other important players repressing unscheduled SINE transcription and amplification are histone and chromatin modifiers acting through reorganization of the local chromatin [18, 19]. Finally, small RNAs like siRNAs and piRNAs, also actively expressed by mammalian germ cells, are important regulators of the retrotransposon silencing process that occurs during gametogenesis [20]. Interestingly, many of these siRNAs and piRNAs seem to be originated from repetitive sequences. SINE transcription may produce double-stranded RNA molecules (dsRNAs) with a secondary structure resulting from intramolecular folding. These dsRNAs might be detected and processed by endonucleases using a mechanism similar to that employed by DICER to generate siRNAs [21]. Supporting this hypothesis, a decrease in DICER expression leads to an increase in Alu transcript levels in retinal pigmented epithelial cells and DICER can degrade Alu-derived dsRNAs in vitro [22].
In summary, the regulation and control of SINE transcription is likely a key process to preserve the physiology and homeostasis of specific tissues and organs (Fig. 1). This implies that the analysis of SINE expression is relevant to understand the mechanisms by which these elements affect cell functioning. SINE transcription can be measured by several available methods.

Schematic representation of the importance of transcription of SINE elements to biological processes
In vitro techniques, such as in vitro transcription or retrotransposition colony formation assays, are useful for the dissection of general regulatory pathways involving a specific family of SINEs [17]. However, these methods do not give enough mechanistic insight if we are interested in studying the transcription of specific SINE instances along the genome or in detecting novel SINE amplification events during development. Quantitative real-time PCR protocols can be designed to perform these specific analyses; however, NGS tools need to be applied for whole genome analysis of SINEs-derived transcription, where information involving millions of sequence reads need to be processed. Although a great effort has been invested in recent years to develop these techniques, there are still important limitations that make difficult the application of NGS to the study of retrotransposon expression. Particularly relevant are the reduced length and the repetitive nature of SINE elements, two properties that jeopardize the identification and functional validation of single SINE instances regulating cell functions. In this chapter, we propose and discuss several methods to overcome these constraints using an RNA-seq analytic protocol specifically designed for SINE detection.
2 Materials
The main equipment for RNA-seq analysis of SINE expression consists in one of the commercially available pyrosequencers for NGS . Illumina sequencers ranging in sequencing power from the MiSeq to the more potent HiSeq 2500 allow the reading of millions of sequences with maximum read lengths of 2 × 300 bp. Other technical alternatives like the Applied Biosystems SOLiD system, IonTorrent PGM, or the Roche-454 sequencers offer similar capabilities with differences in efficiency and/or price.
Additional equipment necessary for the sequencing of SINE-derived small RNA transcripts includes both a DNA electrophoretic system and a NanoDrop spectrophotometer, which are used for size fractionation and for quality assessment of SINE RNA transcripts. In addition, to isolate and to purify small RNAs from tissues and cell cultures, several commercial products can be used such as the QIAGEN miRNeasy kit. A real-time thermocycler can be also used for the validation of the results generated by the RNA-seq analysis.
Finally, very important items needed for this protocol are the hardware and software to analyze the raw data obtained from the sequencer. Our recommendation is to use a dedicated computer with at least 8 GB RAM, 1 TB of hard disk and running a distribution of Linux as Operating System. Software utilized in this protocol comprises Perl, MATLAB, SamTools, BWA, and Blast. Other tools like Python or R can be alternatives to some of the latter.
3 Methods
3.1 Preparation of RNA Extracts from Cell Cultures
-
1.
5 × 10⁶ cells cultured in 100 mm plates are used as input material. See Note 1 for additional comments about the use of fresh or frozen tissues as input as well as other commentaries regarding RNA extraction.
-
2.
RNA extraction is performed with the QIAGEN miRNeasy kit. This method allows the isolation of total RNA molecules with a size above 18 nucleotides.
-
3.
The quality of purified RNA is assessed by spectrophotometric (NanoDrop, 260/280 ratio of ~2) and electrophoretic (RNA Integrity Number, RIN > 8, using Agilent RIN software [23]) methods.
3.2 Sequencing SINE RNAs
-
1.
The following steps are normally done in a next-generation sequencing service. See Note 2 for additional comments on the process.
-
2.
RNA is converted into cDNA using random hexamers, and the second strand is synthesized using Illumina TruSeq protocols.
-
3.
Proprietary Illumina adaptors (120 nucleotides in length) are ligated to the RNA sequences. This process prepares the RNA fragments to be sequenced in an Illumina machine. It also allows the multiplexing capability of the RNA-seq to share a single Illumina run for several distinct samples.
-
4.
The samples are separated electrophoretically in agarose gels and the fragments of interest are recovered and purified using commercially available products like the QIAGEN Gel Extraction kit, taking into account that the fragments are 120 nucleotide longer due to the addition of the Illumina adaptors. As an example, fragments from 180 to 400 nucleotides can be excised and purified for Alu -derived RNA transcripts.
-
5.
After the libraries have been prepared, RNA-seq can be performed using different approaches like the 1 × 75 runs in a Next-Generation Sequencer Illumina MiSeq.
3.3 Pre-processing the Raw Sequence Data
-
1.
The raw data from a NGS service usually consist into separated FASTQ files for each sample used in the experiment. These sequence files lack adaptor sequences and usually contain several million reads. For that, files are big in size and the standard procedure to download them to our personal computer or server is through the File Transferring Protocol (FTP) from the sequencing service. See Note 3 for additional comments about pre-processing of data.
-
2.
In some cases, FASTQ files must be converted into FASTA format. FASTA is an standard in bioinformatic studies, and it is necessary for subsequent analyses using Blast or other additional tools. There are several methods to convert FASTQ in FASTA; one command in a Perl/Linux environment is: cat /path/to/file.fastq | perl -e '$i=0;while(<>){if(/^\@/ && $i==0){s/^\@/\>/;print;}elsif($i==1){print;$i=−3}$i++;}'> path/to/new/
file.fasta
-
3.
For certain analyses, FASTQ reads will have to be placed into the positions of a particular genome. Some tools that will be of help for the process are the BWA and SamTools. To do that, we first index a reference genome or a transcriptome :
bwa index -c /path/to/genome.fasta
We then align our reads to the genome:
bwa aln -c /path/to/genome.fasta path/to/file.fastq > /path/to/align.sai
Transform the binary into a more readable SAM file:
bwa samse -c path/to/genome.fasta path/to/file.fastq /path/to/align.sai /path/to/file.fastq > /path/to/file.sam
This SAM file will be sorted and indexed:
samtools -sU /path/to/file.sam -o /path/to/file.bam
samtools -sort /path/to/file.bam
samtools -index /path/to/file.sorted.bam
To generate a final file that will be file.sorted.bam.bai, small enough to be copied and transferred using regular methods such as e-mail.
3.4 Analysis of the Processed Data
-
1.
Now that the files of our sequenced samples have been processed, we can use them to infer novel data from such results (Fig. 2). We will briefly explain two different protocols intended to obtain the expression profiles of specific SINE families, but there are other potentially new methods that can benefit from variations of these protocols. In Note 4 , we underline some of the updates and comment tips for the computational analysis of SINE RNA-seq .
Fig. 2 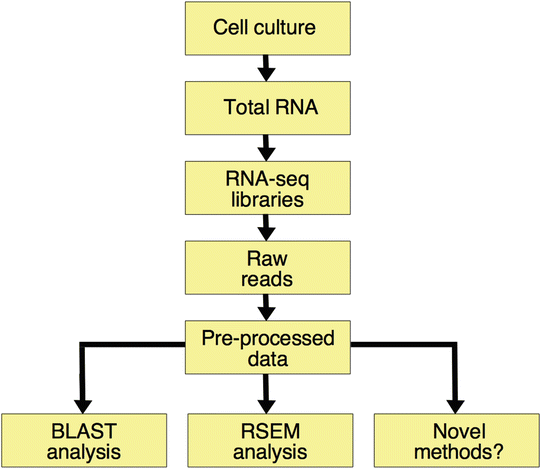
Flowchart of the protocol for RNA-seq analysis of SINE expression
-
2.
Quantification of SINE RNAs families using aligned reads and RSEM or eXpress. The amount of SINE RNA can be measured with a program like RSEM [24]. In this case, a crucial step is the selection of the reference transcriptome FASTA file (see step 4 in Subheading 3.3). A general transcriptome FASTA dataset obtained from a database like Ensembl can be used, or you can prepare a custom-made file. This is an important issue because if a FASTA file is created with, for example, a general representation of SINE families, a quantification of the expression of these elements can be performed. In addition, the aligning process in the BWA align command can be adjusted to permit sequence mismatches (with -M and -n parameters). Finally, the parameter (-o 0) should be used in the same command to avoid gaps in the alignment, as RSEM do not allow for gaps in the sequences. In this way, two different approaches can be used: (1) few SINE families in the reference transcriptome with flexibility in read alignment, or (2) more detailed SINE subfamilies in the reference transcriptome with additional post-processing to summarize the values in the families. An example command is:
rsem-calculate-expression –bam --no-bam-output /path/to/file.sorted.bam.
bai /path/to/ transcriptome .fa name_of_sample
Important resulting files from the analysis are “name_of_sample.genes.results” and “name_of_sample.isoforms.results”. These are tab-separated files easy to use for post-processing and for their analysis in programs like R or MATLAB. These programs have several parameters to indicate the expression level of each gene/isoform, among them, FPKM (Fragments per Kilobase of gene/isoform per Million Reads). If the expression of SINE families between different samples are to be compared, ad hoc standard post tests for genome-wide studies can be used if the number of elements in the transcriptome is high enough. In addition, the usage of permutation approaches for the generation of a p-value quantifying the probability of a significant difference in SINE expression is also recommended. In brief, that method consists in permuting the result values in such a way that each value is assigned to a sample. As a result, data for differences in expression are again obtained. If this process is repeated N times (e.g. 10,000 times), the number of instances in which the difference in expression in permutations is equal or higher than the experimental results can be determined, and P will be calculated dividing this number by N. There are many other approaches to quantify the expression of RNA-seq data such as the eXpress software [25]. This is similar to RSEM, and thus produces a FPKM expression measure for genes and isoforms. A common advantage of these software tools is that they can be run under not only Linux but also Windows and Mac operating systems.
-
3.
Quantification of SINE expression using raw FASTA reads. Another possibility for the analysis of SINE RNA expression consists in the direct use of the raw reads in FASTA format to infer new data of SINE expression levels. In this case, a simple shell script can be prepared to run BLAST under Linux. BLAST [26] is a classic bioinformatic tool which detects database sequences similar to the query. Its main advantages with respect to other more recent programs are its simplicity and flexibility. Although initially designed for evolutionary purposes, BLAST can be customized far enough to be adapted for other needs. For example, some useful commands could be the following:
makeblastdb -in /path/to/file.fasta -dbtype nucl
makeblastdb -in /path/to/query.fasta -dbtype nucl
blastn -db ./path/to/file.fasta -query /path/to/query.fasta -outfmt "7 qacc qstart qend evalue" -out /path/to/results.txt
The first two commands index both the sequence and the query databases. That is necessary for BLAST, and it is done only once. The second command searches the database of our raw reads with a list of query sequences (also in FASTA format). The results obtained will be a tabulated list of BLAST outputs (one for each query sequence) concatenated, with the Query accession, the Query Start, the Query End, and the E-value for each positively identified target. Again, as in Subheading 2 above, prediction can be modulated using gap and mismatch penalties, in order to maintain sensitivity without decreasing specificity. These tabulated files are fitted for statistical post-processing with programs like R and MATLAB. In addition to assessing expression differences between samples or SINEs, interesting data about the relative position of transcripts within a SINE can be obtained with this analysis. For instance, we can study if a SINE is expressed producing similar levels of different transcripts along the element, or if there are transcriptional peaks originated from specific regions of the element. Those possible outcomes might point to the existence of different isoforms of SINE transcripts, like in the case of human Alus that can produce small cytoplasmic and full Alu -derived sequences [27]. As in the prior protocol, standard or custom statistical tests are required to evaluate the significance of the results.

4 Notes
-
1.
Fresh or frozen tissues can be also processed for RNA extraction; commercial RNA purification kits fit specific requirements for RNA isolation. We recommend the use of homogenizers such as motor-driven grinders for soft tissues and an IKA Ultra-Turrax apparatus for harder or more difficult tissues. Life Technologies’ RNA later or similar alternatives for RNA stabilization are highly recommended for the analysis of frozen tissues.
-
2.
The steps indicated in Subheading 3.2 are normally performed in a next-generation sequencing facility. Nevertheless, it is very useful to know and to compare the technical specifications of several sequencing platforms to understand which one is the best for our specific experiments. The analysis of small RNAs from SINE elements is currently not very common in most of these facilities. For those experiments, it is particularly important to establish a constant flow of information between technical assistants and scientists in order to select the best steps to be followed regarding library generation, adapters, and sequencing protocol.
-
3.
There are additional computational tools to pre-process the data. We select the set formed by Perl/BWA/Samtools because of their wide implementation. New users of the Linux environment will normally experience some difficulties and, in that context, previous information from other users deposited in Internet could be of great help. We therefore strongly recommend the use of a general Linux distribution, like Fedora or Ubuntu, for similar reasons. Finally, we also advise to learn the basics of shell scripting to be able to save, comment, and finally reuse the commands that were previously run. These will also warrantee the standardization of the protocols (similar to molecular ones), a rapid error detection capability and the potential to modify methods, altogether saving much time.
-
4.
The quantification of SINE expression needs to be carefully assessed for the presence of errors. The nature of SINE elements (small, repetitive) makes them prone to errors. We suggest a few controls for the proposed analyses to avoid the misdetection of SINEs. The more precise is the detection, the higher is the probability of errors. In this context, to quantify the expression of a single SINE instance in the genome, control sequences with little modifications should be analyzed in parallel. For example, another instance of the same subfamily or the general sequence of its subfamily could be used. Then, the results obtained can be compared with the previous ones got with your original query to assess if there were due to a subfamily effect. Even when we suggest two different methods for RNA-seq analysis of SINE expression, there are other approaches that can be used for similar targeted studies. Modified versions of these protocols can be adapted to the analysis of, for example, the detection of SINE amplification in specific cellular conditions. Aligning our reads to a reference genome could allow us to find novel neighboring regions to SINE retrotransposons.
References
Deininger PL, Batzer MA (2002) Mammalian retroelements. Genome Res 12:1455–1465
Bennett EA, Keller H, Mills RE et al (2008) Active Alu retrotransposons in the human genome. Genome Res 18:1875–1883
Roman AC, Benitez DA, Carvajal-Gonzalez JM et al (2008) Genome-wide B1 retrotransposon binds the transcription factors dioxin receptor and Slug and regulates gene expression in vivo. Proc Natl Acad Sci U S A 105:1632–1637
Wang T, Zeng J, Lowe CB et al (2007) Species-specific endogenous retroviruses shape the transcriptional network of the human tumor suppressor protein p53. Proc Natl Acad Sci U S A 104:18613–18618
Borchert GM, Holton NW, Williams JD et al (2011) Comprehensive analysis of microRNA genomic loci identifies pervasive repetitive-element origins. Mob Genet Elements 1:8–17
Gu TJ, Yi X, Zhao XW et al (2009) Alu-directed transcriptional regulation of some novel miRNAs. BMC Genomics 10:563
Cowley M, Oakey RJ (2013) Transposable elements re-wire and fine-tune the transcriptome. PLoS Genet 9, e1003234
Jacques PE, Jeyakani J, Bourque G (2013) The majority of primate-specific regulatory sequences are derived from transposable elements. PLoS Genet 9, e1003504
Singer MF (1982) SINEs and LINEs: highly repeated short and long interspersed sequences in mammalian genomes. Cell 28:433–434
Weiner AM (1980) An abundant cytoplasmic 7S RNA is complementary to the dominant interspersed middle repetitive DNA sequence family in the human genome. Cell 22:209–218
Deininger PL, Jolly DJ, Rubin CM et al (1981) Base sequence studies of 300 nucleotide renatured repeated human DNA clones. J Mol Biol 151:17–33
Rubin CM, Houck CM, Deininger PL et al (1980) Partial nucleotide sequence of the 300-nucleotide interspersed repeated human DNA sequences. Nature 284:372–374
Kramerov DA, Grigoryan AA, Ryskov AP et al (1979) Long double-stranded sequences (dsRNA-B) of nuclear pre-mRNA consist of a few highly abundant classes of sequences: evidence from DNA cloning experiments. Nucleic Acids Res 6:697–713
Okada N (1991) SINEs. Curr Opin Genet Dev 1:498–504
Geiduschek EP, Kassavetis GA (2001) The RNA polymerase III transcription apparatus. J Mol Biol 310:1–26
Jurka J (1997) Sequence patterns indicate an enzymatic involvement in integration of mammalian retroposons. Proc Natl Acad Sci U S A 94:1872–1877
Dewannieux M, Esnault C, Heidmann T (2003) LINE-mediated retrotransposition of marked Alu sequences. Nat Genet 35:41–48
Adeniyi-Jones S, Zasloff M (1985) Transcription, processing and nuclear transport of a B1 Alu RNA species complementary to an intron of the murine alpha-fetoprotein gene. Nature 317:81–84
Ichiyanagi K, Li Y, Watanabe T et al (2011) Locus- and domain-dependent control of DNA methylation at mouse B1 retrotransposons during male germ cell development. Genome Res 21:2058–2066
Watanabe T, Totoki Y, Toyoda A et al (2008) Endogenous siRNAs from naturally formed dsRNAs regulate transcripts in mouse oocytes. Nature 453:539–543
Kim W, Benhamed M, Servet C et al (2009) Histone acetyltransferase GCN5 interferes with the miRNA pathway in Arabidopsis. Cell Res 19:899–909
Kaneko H, Dridi S, Tarallo V et al (2011) DICER1 deficit induces Alu RNA toxicity in age-related macular degeneration. Nature 471:325–330
Schroeder A, Mueller O, Stocker S et al (2006) The RIN: an RNA integrity number for assigning integrity values to RNA measurements. BMC Mol Biol 7:3
Li B, Dewey CN (2011) RSEM: accurate transcript quantification from RNA-seq data with or without a reference genome. BMC Bioinformatics 12:323
Roberts A, Pachter L (2013) Streaming fragment assignment for real-time analysis of sequencing experiments. Nat Methods 10:71–73
Altschul SF, Gish W, Miller W et al (1990) Basic local alignment search tool. J Mol Biol 215:403–410
Maraia RJ, Driscoll CT, Bilyeu T et al (1993) Multiple dispersed loci produce small cytoplasmic Alu RNA. Mol Cell Biol 13:4233–4241
Author information
Authors and Affiliations
Corresponding author
Editor information
Editors and Affiliations
Rights and permissions
Copyright information
© 2016 Springer Science+Business Media New York
About this protocol
Cite this protocol
Román, Á.C., Morales-Hernández, A., Fernández-Salguero, P.M. (2016). RNA-Seq Analysis to Measure the Expression of SINE Retroelements. In: Garcia-Pérez, J. (eds) Transposons and Retrotransposons. Methods in Molecular Biology, vol 1400. Humana Press, New York, NY. https://doi.org/10.1007/978-1-4939-3372-3_7
Download citation
DOI: https://doi.org/10.1007/978-1-4939-3372-3_7
Published:
Publisher Name: Humana Press, New York, NY
Print ISBN: 978-1-4939-3370-9
Online ISBN: 978-1-4939-3372-3
eBook Packages: Springer Protocols