
Abstract
Recent advancements have driven the development of smaller footprint, less expensive, and user-friendly flow cytometers introducing the technology to more users.
Flow cytometry is an established tool for multiparametric analysis of various important cellular characteristics. Fluorescent dyes or fluorophore-conjugated antibodies allow for measurement of protein expression, identification of cell populations, or DNA content analysis. This is combined with analysis of light-scattering detection to determine cell size and complexity to allow for the study of complex cell samples, such as whole blood. Through antibody staining for a variety of surface markers as well as intracellular proteins we can also elucidate intracellular signaling, and phosphor-signaling, on a single-cell basis.
Here we describe the application of flow cytometry analysis to the tumor suppressor PTEN in various cancer cell lines and a mouse model.
Access provided by CONRICYT – Journals CONACYT. Download protocol PDF
Key words
1 Introduction
Flow cytometry allows for high-throughput single-cell analysis, in a quantitative as well as qualitative manner [1]. Recent advances in flow cytometry have allowed for a greater access to this technique than ever before in academic, industrial, and clinical settings. Indeed the newest flow cytometers are smaller, more robust, less expensive, have higher throughput, and combine with much more user-friendly software. Flow cytometry can be utilized for the characterization of cells in any fluid (e.g., blood, plasma, cerebrospinal fluid, urine) as well as cell suspensions made from solid tumours, bone marrow, or laboratory-cultured cells. Characteristics that can be measured include cell size, cytoplasmic complexity, DNA or RNA content, and a wide range of membrane-bound and intracellular proteins [2].
A flow cytometry system consists of four main operating units: a light source, flow cell, optical filter units for specific wavelength detection over a broad spectral range, and photodiodes or photomultiplier tubes for sensitive detection of the signals of interest. A cell suspension is injected into the flow cell where the cells pass one after another across a laser beam (or mercury lamp light) that is orthogonal to the flow. Sample delivery has been accomplished using either pumps or an increase of pressure differential between the sample and the system. The use of pumps adds complexity, but offers control over delivery rates, which enables direct counting of particles per unit volume without the addition of a particle standard of a known concentration. Typically, ensuring one particle passes the light source at a time is achieved by hydrodynamic focusing of the sample stream, wherein the sample stream is injected into the sheath stream inside the flow cell. The velocities of both fluids are in the range of laminar flow. Cells are isolated in the focused stream since the sheath flow is greater than the sample flow. This allows cells to be excited by the laser individually. Using this technology, it is possible to detect up to 30,000 events per second [3]. Upon contact with the particle or cell, the excitation light is scattered in both forward and sideways directions. The forward-scattered light (FSC) provides information on the size of the cells and can be detected without further manipulation. The sideways-scattered light (SSC) is affected by several parameters, including granularity, cell size, and cell morphology. Intrinsic fluorescence or cellular components stained with specific fluorescence dyes allow certain cell components to be measured. These signals can be combined in various ways that allow all subpopulations to be observed. Depending on the dyes that are used, many of these measurements can be combined with each other. In modern cytometers, the information from scattered light is always available and can be detected along with as many as 18 fluorescent dyes [3].
Most applications of flow cytometry are based on fluorescence monitoring. The measurable cellular parameters can be characterized as intrinsic or extrinsic, depending on their need for reagents. While usually no pretreatment is necessary for the assay of intrinsic fluorescence, studies of specific cell components with fluorescent dyes (extrinsic fluorescence) requires that a staining procedure be performed before the cells are analyzed. These procedures include fixation, staining, and several washing steps.
Fluorescent labelling of cells is typically achieved by means of fluorescent dyes or antibody-fluorophore conjugates, both of which allow for quantitation of cells or cellular components. Here we discuss the application of primary-conjugated antibodies to measure PTEN levels in cells, both cultured cells and isolated cells from murine spleens.
Through a combination of surface marker staining and intracellular protein staining, characterization of protein expression in specific cell types from complex samples (e.g., blood) can be achieved. However, care must be taken when staining both surface markers and intracellular proteins on the same sample. The issue arises with the effect on surface markers of fixation and permeabilization of the cell, which is necessary for intracellular delivery of antibodies. Some protocols that provide excellent staining of phospho-epitopes decrease staining levels of particular surface antigens, while preservation of surface epitopes leads to weak phospho-staining [4]. This balance between surface and intracellular epitopes must be kept in mind while attempting to stain particular antigens. For example, the mouse B-cell marker CD19 is exquisitely sensitive to methanol permeabilization [5]. Thus we recommend that surface markers are measured before and after fixation/permeabilization and protocols are optimized for each combination of surface markers and intracellular proteins.
The ability to probe phosphorylated products in a multiparametric assay, alongside surface marker staining, in complex samples is particularly useful. Such assays allow researchers to test the activity of multiple signaling pathways at the same time in cells, and thus the interactions between these pathways on a cell-to-cell basis, in conjunction with protein expression and surface marker data. In the context of PTEN expression level, this would allow the characterization of phosphorylation status of downstream signaling effectors such as Akt or RPS6.
Measurement of protein expression via flow cytometry offers many advantages in both clinical and research settings. Because it allows for multiparametric measurement, reduced sampling can be achieved. This is especially important in clinical monitoring or diagnosis, whereby sampling is often not trivial (e.g., blood or bone marrow draws). It also allows for separating complex/mixed samples to be separated using specific markers, and subsequent measurement of characteristics of interest. This is of particular interest for a protein such as PTEN, which is the focus of significant research interest and is associated with multiple cancers.
2 Materials
2.1 Cell Lines
The following human leukemia cell lines were used in these studies: HL-60, U937, OCI/AML-3, and MV4-11.
-
1.
HL-60 cells were established from the peripheral blood of a 35-year-old woman with acute myeloid leukemia (AML FAB M2 [6]). HL-60 cells resemble promyelocytes but can differentiate terminally in vitro in the presence of dimethylsulfoxide (DMSO) or retinoic acid to granulocytes [7]. Other compounds like 1,25-dihydroxyvitamin D3, 12-O-tetradecanoylphorbol-13-acetate (TPA), and GM-CSF can induce HL-60 to differentiate to monocytic, macrophage-like, and eosinophil phenotypes, respectively.
-
2.
U937 are myeloid cells established from the pleural effusion of a 37-year-old male patient with histiocytic lymphoma [8]. U937 cells mature in the presence of numerous soluble stimuli, adopting the characteristics and morphology of macrophages [9].
-
3.
OCI/AML3 cells were established from the peripheral blood of a 57-year-old man with acute myeloid leukemia (AML FAB M4; [10]). OCI/AML3 are known to carry a mutation in the NPM1 gene (type A) and in DNMT3A (R882C; [11]).
-
4.
MV4-11 cells were established from a 10-year-old boy with acute monocytic leukemia (AML FAB M5; [12]). These cells are known to carry a chromosomal translocation at t(4;11) and are homozygous for the internal tandem duplication of the FLT3 gene (FLT3-ITD; [13]).
2.2 Cell Line Maintenance
HL-60 and OCI/AML-3 cell lines were maintained at a culture density of 1 × 10⁵–1 × 10⁶ cell/mL in 10 mL of alpha-MEM medium supplemented with 10 % fetal calf serum (FCS, v/v), 100 units of penicillin per mL, and 100 μg of streptomycin per mL at 37 °C and 5 % CO2.
U937 and MV4-11 cell lines were maintained at a culture density of 1 × 10⁵–1 × 10⁶ cell/mL in 10 mL of RPMI 1640 medium supplemented with 10 % fetal calf serum (FCS, v/v), 100 units of penicillin per mL, and 100 μg of streptomycin per mL at 37 °C and 5 % CO2.
2.3 Mouse Models
All mouse experiments were performed using male C57/BL6 young adult mice (10 weeks). Animals were obtained from the Jackson Laboratory (Bar Harbor, MA, USA). The animals were housed in standard 12-h light:dark cycle and at a temperature of 23 °C with free access to food and water in groups of five mice. All experimental protocols were approved by the research ethics board of this university and were carried out in compliance with the Canadian Council on Animal Care recommendations.
2.4 Equipment
In this study we analyzed cell samples by means of a Cytoflex flow cytometer (see Note 1 ; Beckman Coulter, Mississauga, ON, Canada). The CytoFLEX is a three-laser system including lasers at wavelengths of 488 nm, 638 nm, and 405 nm. This allows for a variety of configurations of 4–13 colors with changeable band-pass filters. There are three light scatter parameters, the typical blue laser scatter yielding forward and side scatter, and an additional side scatter parameter off the 405 nm laser. Pulse height and area are collected for all parameters, and a width signal can be selected for any one of the parameters. Emitted light is collected by fiber-optic bundles and carried to fiber array photo detector modules, where it exits to pass through wavelength division multiplexers, which replace conventional dichroics, to partially split the light into distinct ranges, which is then further refined by band-pass filters. The light then is detected by an avalanche photodiode, rather than a conventional photomultiplier tube.
The fluidics system is controlled via peristaltic pumps for both the sheath and sample lines, and the sample volume flow rates can range up to 240 μL/min. Here we will utilize the 488 nm laser with the one forward scatter and one side scatter parameter.
The software used to analyze flow cytometry data was CytExpert (Beckman Coulter, Canada) and FlowJo Vx (FlowJo LLC, Ashland, OR, USA).
2.5 General Equipment
Centrifuge, microcentrifuge, Gilson pipetman (P10, P20, P200, P1000), dissection kit, 70 μM cell strainer, 26-gauge needles and syringes, 15 mL centrifuge tubes, 1.5 mL microcentrifuge tubes.
2.6 Antibodies
-
1.
PTEN-PE (624048; BD Biosciences, San Jose, CA, USA).
-
2.
CD45.2-FITC (see Note 2 ; 11-0454-81; eBiosciences, San Diego, CA, USA).
2.7 Reagents
-
1.
Red blood cell (RBC) lysis buffer: 155 mM Ammonium chloride (NH4Cl), 12 mM sodium bicarbonate (NaHCO3), and 0.1 mM EDTA were prepared in double-distilled H2O.
-
2.
Phosphate-buffered saline (PBS): 8 g NaCl, 0.2 g KCl, 1.44 g Na2HPO4, 0.24 g KH2PO4 in 1 L of double-distilled H2O. pH 7.4.
-
3.
Fixation buffer: 8 % Formaldehyde (v/v) in PBS. Should be made fresh from paraformaldehyde.
-
4.
Permeabilization buffer: 0.2 % Triton-x100 (v/v) in PBS.
-
5.
Staining buffer: 5 % FCS in PBS, made fresh. If not made fresh, an antimicrobial agent such as sodium azide (at a concentration of 0.1 % v/v) should be added.
3 Methods
3.1 Cell Line Collection for Flow Cytometry
-
1.
Cell lines were cultured to a density of 5 × 10⁵ cells/mL and then collected in 15 mL centrifuge tubes.
-
2.
Cells were centrifuged at 400 × g for 5 min.
-
3.
Supernatant medium was removed.
-
4.
Cells were washed with 1 mL of PBS.
-
5.
Cells were resuspended in 1 mL of PBS.
3.2 Mouse Splenocyte Collection for Flow Cytometry
-
1.
C57/BL6 mice were sacrificed at 10 weeks.
-
2.
Spleens were isolated postmortem and placed in PBS on ice.
-
3.
Splenocytes were isolated utilizing the thumb piece of a plunger removed from a 1 mL syringe, mashing the spleen through a 70 μM cell strainer into ice-cold PBS.
-
4.
Splenocyte preparation was passed through 70 μM cell strainer to remove debris.
-
5.
Cells were then transferred to a 15 mL centrifuge tube.
-
6.
This was then centrifuged at 400 × g for 5 min.
-
7.
Splenocytes were resuspended in RBC lysis buffer and vortexed briefly (see Note 3 ). The cells were allowed to incubate for 10 min.
-
8.
Cells were then centrifuged at 400 × g for 5 min and supernatant was removed.
-
9.
Cells were resuspended in PBS and kept on ice.
3.3 Cell Fixation and Permeabilization (See Note 4)
-
1.
1 mL of freshly made 8 % paraformaldehyde fixation buffer was added dropwise to 1 mL of cell suspension (from Subheading 3.1 or 3.2) in a 15 mL centrifuge tube (see Note 5 ). This 1:1 ratio gave a final concentration of 4 % paraformaldehyde to fix cells.
-
2.
This cell fixation mixture was briefly vortexed and then placed in a 37 °C water bath for 10 min.
-
3.
Cells were removed from water bath and to this 2 mL of fix cells, 2 mL of 0.2 % Triton-X100 permeabilization buffer was added dropwise while gently vortexing to prevent clumping of cells. This 1:1 ratio gives a final concentration of 0.1 % Triton-X100 to permeabilize cells.
-
4.
Cells were allowed to permeabilize for 30 min on ice.
-
5.
Cells were centrifuged at 400 × g for 15 min.
-
6.
Cells were resuspended in flow cytometry staining buffer, made fresh on the day of staining.
-
7.
Cells were stored on ice for 30 min prior to staining.
3.4 Cell Staining for Flow Cytometry
-
1.
50 μL of fixed cell suspension in staining buffer (from Subheading 3.3) was transferred to microcentrifuge tubes.
-
2.
Antibodies were added in the appropriate concentrations (see Note 6 ). PTEN-PE was stained at 10 ng in 100 μL PBS; CD45.2-FITC was stained at 10 ng in 100 μL PBS.
-
3.
Cells were stained for 30 min in the dark at room temperature.
-
4.
Cells were centrifuged 400 × g for 5 min.
-
5.
Cells were washed once with staining buffer.
-
6.
Cells were resuspended in 200 μL of staining buffer.
3.5 Flow Cytometric Analysis
-
1.
Cells (from Subheading 3.4) were analyzed for fluorescence on a Cytoflex flow cytometer (Beckman Coulter).
-
2.
Cells were gated on FSC vs. SSC to identify the correct, viable cell population (see Fig. 1a).
Fig. 1 
Cell line gating strategy. (a) 10,000 cells were gating on FSC vs. SSC parameters. Threshold was set to remove debris. (b) Cells were then gated on FSC-area vs. -height to identify singlet cells and remove any doublet cells from further analysis
-
3.
Gated cells were further gated on FSC-area vs. -height to discriminate singlet cells from doublet cells (see Fig. 1b).
-
4.
Single cells from cell lines were analyzed for fluorescence signal of PTEN conjugated to PE (see Fig. 2), using the U937 cell line as a negative control for PTEN expression (see Note 7 ).
Fig. 2 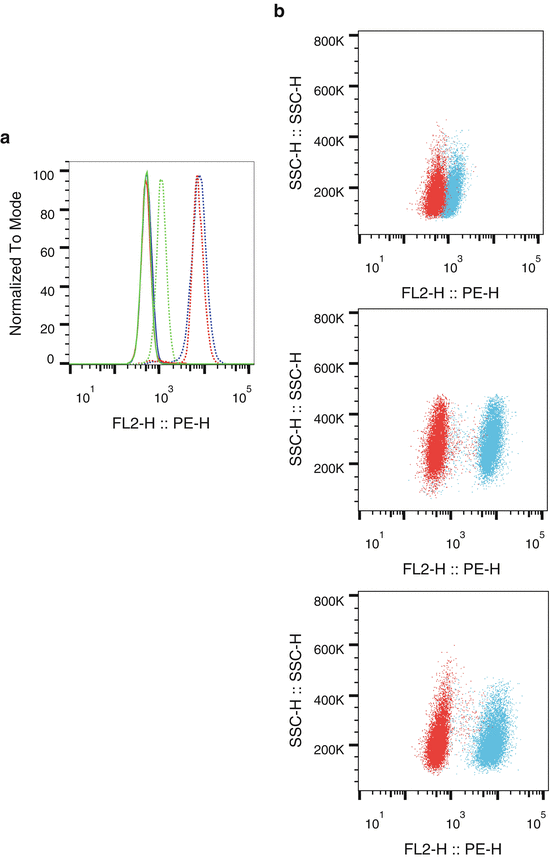
PTEN expression in cell lines. (a) U937 (green), AML2 (red), and HL-60 singlet cells (blue) were stained and were examined for PTEN expression. Unstained cells (solid lines) were compared against cells stained with a PTEN-PE antibody (dotted lines) for FL2 fluorescence on a histogram overlay. (b) U937 (top), AML2 (middle), and HL-60 (bottom) cells were examined for PTEN expression. Unstained cells (red) were plotted with PTEN-PE-stained cells (blue) on dot-plots of FL2 vs. SSC
-
5.
Mouse spleen cells stained with CD45.2-FITC and PTEN-PE were gated for mononuclear cells according to FSC vs. SSC intensity (see Fig. 3).
Fig. 3 
Mouse splenocyte gating. Isolated spleen cells from C57/BL6 cells are displayed on a FSC vs. SSC plot. Mononuclear cells were gated, excluding debris from further analysis
-
6.
Mononuclear splenocytes were then displayed as FL1 vs. SSC to determine CD45.2 staining intensity (see Fig. 4a). Cells were gated as positive/bright vs. negative/dim for CD45.
Fig. 4 
CD45.2 and PTEN co-expression in murine splenocytes. Cells isolated from C57/BL6 mice were co-stained with CD45.2-FITC and PTEN-PE. (a) Cells were gated as CD45.2-positive and CD45.2-negative. (b) CD45.2-negative cells (red) and CD45.2-positive cells (blue) were plotted on an overlay histogram for PE fluorescence, demonstrating that CD45.2-positive cells display a higher PTEN expression than CD45.2-negative cells
-
7.
Cells were plotted as CD45-positive and CD45-negative on a histogram overlay to display PTEN-PE staining in these two populations (see Fig. 4b). From this we identified CD45-positive cells as high expressers of PTEN.
-
8.
Splenocytes stained solely with PTEN-PE were gated on FSC vs. SSC showing three populations (see Fig. 5a). These cells correspond to lymphocytes (P1), monocytes (P2), and granulocytes (P3). Plotting these populations on a histogram overlay for PTEN-PE shows that PTEN is expressed highly in the granulocyte population (see Fig. 5b).
Fig. 5 
PTEN expression in murine spleen. Cells isolated from C57/BL6 mice were stained for PTEN-PE only. (a) Cells were gated as lymphocytes (P1), monocytes (P2), and granulocytes (P3). (b) These populations were then plotted on a histogram overlay showing P1 (red), P2 (blue), and P3 (green). From this we can see that granulocytes express a noticeably higher level of PTEN than either monocytes or lymphocytes which both express similar levels


4 Notes
-
1.
In this work we make use of the Cytoflex flow cytometer (Beckman Coulter); however the methodology described here is general and can be undertaken with almost any flow cytometer capable of quantifying fluorescein isothiocyanate (FITC) and phycoerythrin (PE) fluorescence.
-
2.
The C57/BL6 mouse spleen is a source of both myeloid and lymphoid cells. The wild-type C57/BL6 mice express the CD45.2 allele as opposed to the CD45.1 allele expressed on, for example, SJL mice [14]. CD45 vs. SSC plots allow for better identification of blood cell populations than simply using FSC vs. SSC, with separation of blasts and plasma cell, precursors, and erythroid cells [15].
-
3.
It is desirable to remove erythrocytes from spleen mononuclear cell preparations prior to flow cytometry experiments as large numbers of RBCs in the sample can occlude populations of interest [16]. A small number of RBCs remaining in the sample will not prove difficult to gate out however, so partial lysis of RBCs is sufficient and should be optimized depending on the individual experiment being performed.
-
4.
In order to detect intracellular antigens, cells first must be permeabilized especially after fixation with cross-linking agents such as formaldehyde and glutaraldehyde [17, 18]. Permeabilization is required to allow complex macromolecules such as antibodies to cross the cell membrane. Two general types of reagents are commonly used: organic solvents or detergents. The organic solvents dissolve lipids from cell membranes making them permeable to antibodies. Because the organic solvents also coagulate proteins, they can be used to fix and permeabilize cells at the same time. However, these solvents may also extract lipidic antigens or lipid-associated antigens from cells. The other large class of permeabilization agents is detergents. Saponin, a plant glycoside, interacts with membrane cholesterol, selectively removing cholesterol and making holes in the membrane. In addition to forming membrane holes, antibodies may be incorporated into saponin/cholesterol micelles facilitating their entry into the cells. Saponin permeabilization is not effective on mitochondrial membranes or the nuclear envelope. Nonionic detergents such as Triton X-100 and Tween 20 are also widely used to permeabilize cells and tissues [19]. The disadvantage of these detergents is that they are nonselective in nature and may extract proteins along with the lipids, resulting in a false negative during immunostaining. Depending on the antigen, a combination of permeabilizing agents may be preferable. It is absolutely essential to optimize fixation/permeabilization protocols for each antibody-antigen pair being tested to ensure efficient staining and to minimize false-negative staining.
-
5.
Here we fix cells in a 4 % formaldehyde solution. There are numerous methods to prepare this fixative from stock solutions [4]. The most common options are to begin with paraformaldehyde, a polymerized formaldehyde, or formalin. Paraformaldehyde is usually sourced as a powder, and can be prepared as a 4 % solution (w/v) directly with heating to break down polymers. Formalin is generally sourced as 37–40 % formaldehyde solution, as the formaldehyde gas is dissolved in water at a saturating concentration somewhere between these concentrations. This formalin can be diluted 1:10 to achieve a 4 % fixative solution. It should also be noted that typically formalin will contain methanol, to prevent polymerization, so the final fixative will contain a small amount of methanol.
-
6.
The importance of antibody titrations in flow cytometry should not be underestimated. Efficient antibody titration identifies the concentration of the antibody which, under specific staining conditions, will deliver optimal separation between positive and negative populations. Supersaturating concentrations will increase background and nonspecific binding and is not cost effective. Non-saturating concentration may cause sample-to-sample variation and decrease resolution and sensitivity. At saturating staining concentrations the amount of antibody present is not limiting and is sufficient to stain all relevant antigens without significantly lowering the concentration of free antibody. Therefore the antibody concentration but not the number of cells is critical for optimal staining. The optimal antibody concentration must be determined for each application and set of experimental conditions (including staining time and temperature) and is determined by using a series of dilutions. Prior to running these experiments, we determined the optimal concentration for PTEN-PE in these leukemia cells to be 10 ng in 100 μL, stained for 30 min, by titration (data not shown).
-
7.
In this work we utilized the U937 cell line as a negative control for PTEN antibody staining. U937 has previously been shown to display low or undetectable PTEN expression, and indeed has been characterized with hemizygous deletion of PTEN [20].
References
Brown M, Wittwer C (2000) Flow cytometry: principles and clinical applications in hematology. Clin Chem 46:1221–1229
Shapiro H (2003) Practical flow cytometry, 4th edn. Wiley-Liss, New York
Picot J, Guerin CL, Le Van Kim C, Boulanger CM (2012) Flow cytometry: retrospective, fundamentals and recent instrumentation. Cytotechnology 64:109–130. doi:10.1007/s10616-011-9415-0
Krutzik PO, Irish JM, Nolan GP, Perez OD (2004) Analysis of protein phosphorylation and cellular signaling events by flow cytometry: techniques and clinical applications. Clin Immunol 110:206–221. doi:10.1016/j.clim.2003.11.009
Krutzik PO, Clutter MR, Nolan GP (2005) Coordinate analysis of murine immune cell surface markers and intracellular phosphoproteins by flow cytometry. J Immunol 175:2357–2365. doi:10.4049/jimmunol.175.4.2357
Collins S, Gallo R, Gallagher R (1977) Continuous growth and differentiation of human myeloid leukaemic cells in suspension culture. Nature 270:347–349. doi:10.1038/270347a0
Breitman TR, Collins SJ, Keene BR (1980) Replacement of serum by insulin and transferrin supports growth and differentiation of the human promyelocytic cell line, HL-60. Exp Cell Res 126:494–498. doi:10.1016/0014-4827(80)90296-7
Sundström C, Nilsson K (1976) Establishment and characterization of a human histiocytic lymphoma cell line (U-937). Int J Cancer 17:565–577
Phillips TA, Ni J, Pan G et al (1999) TRAIL (Apo-2L) and TRAIL receptors in human placentas: implications for immune privilege. J Immunol 162:6053–6059
Wang C, Curtis J, Minden M, McCulloch E (1989) Expression of a retinoic acid receptor gene in myeloid leukemia cells. Leukemia 3:264–269
Hollink IHIM, Feng Q, Danen-van Oorschot AA et al (2012) Low frequency of DNMT3A mutations in pediatric AML, and the identification of the OCI-AML3 cell line as an in vitro model. Leukemia 26:371–373. doi:10.1038/leu.2011.210
Lange B, Valtieri M, Santoli D et al (1987) Growth factor requirements of childhood acute leukemia: establishment of GM-CSF-dependent cell lines. Blood 70:192–199
Quentmeier H, Reinhardt J, Zaborski M, Drexler HG (2003) FLT3 mutations in acute myeloid leukemia cell lines. Leukemia 17:120–124. doi:10.1038/sj.leu.2402740
Shen FW, Saga Y, Litman G et al (1985) Cloning of Ly-5 cDNA. Proc Natl Acad Sci U S A 82:7360–7363. doi:10.1073/pnas.82.21.7360
Haycocks NG, Lawrence L, Cain JW, Zhao XF (2011) Optimizing antibody panels for efficient and cost-effective flow cytometric diagnosis of acute leukemia. Cytometry B Clin Cytom 80B:221–229. doi:10.1002/cyto.b.20586
Bossuyt X, Marti GE, Fleisher TA (1997) Comparative analysis of whole blood lysis methods for flow cytometry. Cytometry 30:124–133
Fox C, Johnson F, Whiting J, Roller P (1985) Formaldehyde fixation. J Histochem Cytochem 33:845–853. doi:10.1056/NEJMra1313875
Pollice AA, McCoy JP, Shackney SE et al (1992) Sequential paraformaldehyde and methanol fixation for simultaneous flow cytometric analysis of DNA, cell surface proteins, and intracellular proteins. Cytometry 13:432–444. doi:10.1002/cyto.990130414
Le Maire M, Champeil P, Møller JV (2000) Interaction of membrane proteins and lipids with solubilizing detergents. Biochim Biophys Acta 1508:86–111. doi:10.1016/S0304-4157(00)00010-1
Dahia PLM, Aguiar RCT, Alberta J et al (1999) PTEN is inversely correlated with the cell survival factor Akt/PKB and is inactivated via multiple mechanisms in haematological malignancies. Hum Mol Genet 8:185–193. doi:10.1093/hmg/8.2.185
Acknowledgements
The research in the Salmena lab is supported by funds from Canada Research Chairs, Human Frontier Science Program Organization, Leukemia and Lymphoma Society of Canada, Canadian Cancer Society, and the Natural Sciences and Engineering Research Council of Canada.
Author information
Authors and Affiliations
Corresponding author
Editor information
Editors and Affiliations
Rights and permissions
Copyright information
© 2016 Springer Science+Business Media New York
About this protocol
Cite this protocol
Woolley, J.F., Salmena, L. (2016). Measurement of PTEN by Flow Cytometry. In: Salmena, L., Stambolic, V. (eds) PTEN. Methods in Molecular Biology, vol 1388. Humana Press, New York, NY. https://doi.org/10.1007/978-1-4939-3299-3_4
Download citation
DOI: https://doi.org/10.1007/978-1-4939-3299-3_4
Published:
Publisher Name: Humana Press, New York, NY
Print ISBN: 978-1-4939-3297-9
Online ISBN: 978-1-4939-3299-3
eBook Packages: Springer Protocols