
Abstract
Reconstitution of P-type ATPases in unilamellar liposomes is a useful technique to study functional properties of these active ion transporters. Experiments with such liposomes provide an easy access to substrate-binding affinities of the ion pumps as well as to the lipid and temperature dependence of the pump current. Here, we describe two reconstitution methods by dialysis and the use of potential-sensitive fluorescence dyes to study transport properties of two P-type ATPases, the Na,K-ATPase from rabbit kidney and the K+-transporting KdpFABC complex from E. coli. Several techniques are introduced how the measured fluorescence signals may be analyzed to gain information on properties of the ion pumps.
Access provided by CONRICYT – Journals CONACYT. Download protocol PDF
Key words
- Reconstitution
- Lipids
- Detergents
- Dialysis
- BioBeads
- Vesicles
- Voltage-sensitive fluorescence dyes
- Electrogenic ion transport
- Pump current
- Substrate dependence
- Membrane potential
1 Introduction
Several P-type ATPase s have been reconstituted functionally in liposomes. This has become a well-established technique since decades and is used to study the transport functions and kinetic properties of several members of this family of ion pumps [1–9]. Various methods have been introduced to reconstitute P-type ATPases in liposomes. It turned out that dialysis methods are favorable because they are so mild that enzyme and transport activity of the reconstituted ion pumps are almost completely retained. Dialysis may be performed using dialysis tubings or BioBeads. Both methods are introduced in the following. Although each method is applied to a specific ATPase in this chapter, each approach may be used respectively also for other ATPases.
The advantage of the use of liposomes is on one hand that purified ATPases are integrated in lipid bilayer membranes without the background transport activity of other proteins. On the other hand, the lipid composition of the membrane may be varied deliberately and is well defined during the experiments. The pump activity can be triggered by addition of ATP , and the substrates in the aqueous compartments on both sides of the membrane can be freely chosen.
The terms “liposomes” and “vesicles” have been used likewise in the literature to refer to unilamellar structures in which transport proteins are integrated into the lipid bilayer, typically in both orientations, cytoplasmic side out and extracellular side out.
When ion pumping is induced by the addition of ATP to the liposome suspension, those ATPases are activated whose cytoplasmic side faces the liposome outside. Inversely reconstituted proteins remain inactive because ATP is unable to permeate through the liposome membrane. Therefore, the condition has to be kept in mind that in experiments performed with liposomes the outside corresponds to the cytoplasmic side of the membrane and the inner volume of the liposomes corresponds to the extracellular phase of the cell.
A consequence of this condition is that in measurements performed with reconstituted liposomes, the composition of the aqueous phase in which the liposomes are prepared represents the extracellular medium. It cannot be easily changed during the experiments. In contrast, the electrolyte solution to which the liposomes are added represents the cytoplasm and it can be ad hoc composed as desired.
To study and analyze ATPase-induced currents across the liposomal membranes, various techniques have been applied. In the beginning, radioactive isotopes, 22Na+ and 42K+ (or its congeners, 86Rb+ and 137Cs+) were used in the case of Na,K-ATPase to analyze pump-mediated fluxes [6, 7, 10–13]. Depending on the transport direction, uptake or release of the isotopes has been detected as function of time and substrate concentrations. This allowed the calculation of pump fluxes and the turnover rate, if the number of active pumps reconstituted in a liposome was known.
Another important experimental technique introduced to study electrogenic activities of the ATPases is the application of potential-sensitive fluorescence dyes. The term electrogenic means that the pump transfers net charge across the membrane while running through the pump cycle and thus modifies the electric potential difference across the membrane. For this purpose so-called slow-response dyes are frequently used which have characteristic time constants of 270 ms or longer [14] but produce fluorescence changes in the order of 1 %/mV change of the membrane potential. Well established dyes in studies with P-type ATPase s are: cationic carbocyanines, such as DiIC1(5) [7] or DiSC3(5) [9, 13, 15], and anionic oxonol dyes, especially Oxonol VI [16–18].
In the following paragraphs (1) the preparation of liposomes with two different P-type ATPase s, the Na,K-ATPase and the K+-transporting KdpFABC complex from E. coli is presented, (2) the execution of fluorescence experiments with potential sensitive dyes is described, and (3) approaches of data analysis of the results of fluorescence experiments are introduced.
2 Materials
Prepare all solution with quartz double-distilled (DD) water. Sterile filtration (pore size 0.2 μm) is performed with all solutions used in fluorescence measurements to remove all contaminations by dust particles and bacteria, and the filtrated solutions are degassed. All solutions are kept at 4 °C unless indicated otherwise. All reagents are of (at least) analytical grade. To reduce the leak conductance of the liposome membranes, all salts are chosen to be sulfates instead of chlorides because the permeability of the sulfate anion is orders of magnitude lower than that of chloride. (Control experiments were performed to show that the enzyme activity of the ATPases was not affected when chloride was exchanged by sulfate.)
-
1.
For dialysis, a tubing of regenerated cellulose is used with a molecular weight cut-off of ~14,000 Da. It turned out that Visking dialysis tubing 8/32, MWCO 12,000–14,000 (Serva Electrophoresis GmbH) is the most efficient choice.
-
2.
Bio-Beads SM-2 (Bio-Rad) are used as adsorbent.
2.1 Solutions for Experiments with Na,K-ATPase Liposomes
-
1.
Standard buffer: 30 mM imidazole, 1 mM ethylenediaminetetraacetic acid (EDTA), 5 mM MgSO4, pH 7.2. To prepare 1 L of buffer weigh 2.04 g imidazole, 0.29 g EDTA, 0.60 g MgSO4, and transfer all components into a 1-L beaker glass. Add 950 mL DD water. Stir with a magnetic stirrer until all components are dissolved. Adjust pH to 7.2 with 1 M H2SO4. (To check pH, immerse the pH electrode each time only for periods as short as possible to avoid significant contaminations by K+ leaking through the ceramic junction of the reference electrode.) Fill the pH-adjusted buffer into a 1-L graduated flask and make up to 1 L with DD water. Store at 4 °C.
-
2.
Buffer H: Standard buffer supplemented with 1 mM l-cysteine. Prepare as described for the Standard buffer, and add 0.12 g l-cysteine before dissolving all components in DD water.
-
3.
Cholate buffer: Buffer H with 1 % (w/v) sodium cholate, 70 mM K2SO4, and 5 mM Na2SO4, pH 7.2. Prepare as Buffer H, to obtain 1 L add 10 g sodium cholate, 12.20 g K2SO4 and 0.71 g Na2SO4 before dissolving all components in DD water.
-
4.
Dialysis buffer 1: Standard buffer with 70 mM K2SO4, and 5 mM Na2SO4, pH 7.2. Prepare as described for the Standard buffer, add 12.20 g K2SO4 and 0.71 g Na2SO4 before dissolving all components in 1 L DD water.
-
5.
Dialysis buffer R: Standard buffer with 0.5 mM K2SO4, and 74.5 mM Na2SO4, pH 7.2. Prepare as described for the Standard buffer, add 0.09 g K2SO4 and 10.58 g Na2SO4 before dissolving all components in 1 L DD water.
-
6.
Cholate-containing lipid stock solution for liposome preparation: 20 mg lipid (e.g., dioleoyl phosphatidylcholine (PC 18:1) as powder, not as chloroform solution, obtained from Avanti Polar Lipids, Inc., Alabaster, AL) are dissolved in 1 mM ethanol (spectroscopic quality). 10 mg sodium cholate are dissolved in 500 μL ethanol (spectroscopic quality). Both components are mixed in a 50 mL round-bottom flask. (The flask has to be extremely well cleaned and dried before use.) The ethanol has to be removed completely by vacuum evaporation under rotation in a water bath at 40 °C for at least 1 h. Finally, a faint, clear film is formed on the flask wall. This film is dissolved in 1 mL DD water by smooth shaking. (Do not vortex to avoid foam formation!) The obtained clear solution is divided in 100 μL aliquots in 0.5 mL Eppendorf vessels and stored frozen at −24 °C. The samples may be stored for months before use. The final concentrations are 20 mg/mL PC 18:1 and 10 mg/mL sodium cholate. (The lipid contents may be checked with the Phospholipids C test from Wako Diagnostics, Wako Life Sciences, Inc. according to their provided protocol.)
-
7.
25 mg/mL E. coli polar lipid extract dissolved in chloroform (Avanti Polar Lipids, Alabaster, USA). Store contents of the opened glass ampule in a tightly sealed glass vial at −24 °C up to 3 months upon opening.
-
8.
Oxonol VI stock solution (1 mM): A small sample (1–2 mg) of the dye Oxonol VI (Molecular Probes, Inc., Eugene, OR) is weighed into a small glass flask and an appropriate volume of ethanol (spectroscopic quality) is added to obtain a 1 mM stock solution. The molar mass of Oxonol VI is 316.4 g. If e.g., 1.5 mg of Oxonol VI are in the glass flask, 4.74 mL of ethanol (spectroscopic quality) are added. The flask with the stock solution is wrapped with aluminum foil to keep it dark. It is tightly sealed and stored at −24 °C (to avoid evaporation of ethanol). Before withdrawal of aliquots from the stock solution, it has to be warmed up to room temperature before opening to avoid condensation of water in the flask.
-
9.
Measurement buffer: Standard buffer with 70 mM Na2SO4, and 5 mM K2SO4, pH 7.2 (unless the Na+ or K+ concentration dependence is studied). Prepare as described for the Standard buffer, add 0.87 g K2SO4 and 9.94 g Na2SO4 before dissolving all components in 1 L DD water.
2.2 Solutions for Experiments with KdpFABC Liposomes
-
1.
Working buffer: 25 mM imidazole, 1 mM ethylenediaminetetraacetic acid (EDTA), 5 mM MgSO4, pH 7.2. To prepare 1 L of buffer weigh 1.70 g imidazole, 0.29 g EDTA, and 0.60 g MgSO4, and transfer all components into a 1 L beaker glass, add 950 mL DD water and stir with a magnetic stirrer until all components are completely dissolved. Adjust pH to 7.2 with 1 M H2SO4. (While adjusting pH, immerse the electrode only for short periods of time to avoid K+ leaking from the reference electrode.) Transfer the pH-adjusted buffer into a 1 L graduated flask and fill up to 1 L with DD water. Store at 4 °C.
-
2.
Dialysis buffer 2: Working buffer with 70 mM K2SO4. Prepare as described for the Working buffer, add 12.20 g K2SO4 before dissolving all components in DD water.
-
3.
Detergent stock solution mixture: 10 % β-DDM and 10 % C12E8 in Dialysis buffer 2. To prepare 1 mL of detergent mixture solution measure 0.10 g β-DDM and 0.10 g of C12E8 and add to 0.5 mL of the Dialysis buffer 2. Stir with a magnetic stirrer until a clear solution is obtained, and fill up to 1 mL with Dialysis buffer 2. Store at −24 °C.
-
4.
DiSC3(5) stock solution: To prepare a solution of 100 mM DiSC3(5) (3,3′-dipropylthiadicarbocyanine iodide) weigh 0.055 g of DiSC3(5) and dissolve in 1 mL of DMSO. Store in a black Eppendorf vessel tightly sealed with parafilm at 4 °C. For fluorescence experiments prepare a 0.3 mM DiSC3(5) solution by 300-fold dilution of the stock solution in DMSO. To prepare the diluted solution, the stock solution has to be warmed up to room temperature before opening to avoid condensation of water in the flask. The effective concentration of the DiSC3(5) solution can be checked spectroscopically. The molar extinction coefficient is 258,000 cm−1 M−1.
-
5.
Dialysis buffer R: Standard buffer with 0.5 mM K2SO4, and 74.5 mM Na2SO4, pH 7.2. Prepare as described for the Standard buffer, add 0.087 g K2SO4 and 10.58 g Na2SO4 before dissolving all components in 1 L DD water.
-
6.
Measurement buffer L: Working buffer with 0.14 mM K2SO4. Prepare as described for the Working buffer, add 24 mg K2SO4 and 19.86 g Na2SO4 before dissolving all components in 1 L DD water. Use pH-indicator strips instead of a pH electrode to avoid K+ contaminations from the electrode.
2.3 Other Solutions
-
1.
Na2-ATP stock solution: To obtain a 1 M ATP solution, 0.551 g of Na2-ATP are weighed into a 1 mL graduated flask and DD water added up to 1 mL. ATP is rapidly dissolved. With a μL droplet on a paper strip pH indicator one can see that the pH is extremely acidic. Additions of ATP in the order of 2.5 μL do not change significantly pH in a buffered solution. If, however, pH adjustment is desired, add only 900 μL DD water to the dry substance of ATP, add 5 μL aliquots of 1 M NaOH and check pH after each addition by applying μL samples on pH-indicator paper until you obtain a value in the range between 6 and 7. Finally, add DD water to obtain 1 mL total volume. Split the volume in aliquots of 10 μL in separate Eppendorf vessels and keep them frozen at −24 °C until used. When thawed for use, keep on ice and discard it at the end of the day. At pH > 6 auto-hydrolysis of ATP is considerable after a day.
-
2.
Mg-ATP stock solution: To prepare a 0.5 M Mg-ATP stock solution weigh 0.25 g of Mg-ATP and dissolve in 1 mL of DD water. Stir with a magnetic stirrer until the compound is dissolved. If the measurements require a constant pH in the cuvette and traces of Na+ ions are not perturbing, the pH of the ATP solution should be adjusted to ~6–7. In this case, dissolve the salt in 900 μL DD water, then add 5 μL aliquots of 1 M NaOH and check pH after each added drop using the indicator paper. Finally, add DD water up to 1 mL. Distribute the volume in aliquots of 10 μL in separate Eppendorf vessels and keep them frozen at −24 °C until used. When thawed for use, keep on ice and discard at the end of the day. At pH > 6 auto-hydrolysis of ATP is considerable.
-
3.
Sodium orthovanadate solution for P-type ATPase inhibition: The substance and its solution are toxic! Apply every appropriate precaution to avoid skin contact and ingestion! To prepare 2 mL of a 200 mM Na3VO4 solution, weigh 109 mg of the dry substance into a small glass beaker and dissolve it in 1.9 mL DD water. A clear solution is obtained. Add 40 μL of 10 M NaOH to the solution to obtain pH ~12 (check with 3 μL solution pipetted on a paper strip pH indicator). Warm up the solution to 95 °C for 5 min and let it cool down to room temperature afterwards. Then add about 80 μL 25 % HCl to obtain pH ~7.5. The solution becomes clear and of bright orange color. Warm up the solution again to 95 °C for 10 min. During this time the solution becomes colorless and its pH rises to ~8. When cooled to room temperature, add approx. 8 μL 25 % HCl to obtain pH 7.5. The solution becomes orange colored. Warm up again to 95 °C for 10 min. The solution becomes clear and colorless, and after cooling pH remains at 7.5. The solution shall be divided in small aliquots of 50–100 μL. These aliquots of stock solution can be kept frozen at −24 °C for long times. Concentration of 0.1–2 mM o-vanadate in the cuvette will inhibit P-type ATPases almost completely.
-
4.
Valinomycin stock solution: To prepare a 1 mM stock solution, weigh 11.1 mg valinomycin dry substance (M = 1111.3 g/mol) into a 10 mL graduated flask and add ethanol (spectroscopic quality) up to 10 mL. The stock solution is stored well sealed at −24 °C to avoid evaporation of the ethanol. For use in the fluorescence experiments diluted solutions may be used. For this purpose, small aliquots are taken from the stock at room temperature and diluted by a factor of 20 to obtain a working solution of 50 μM. Use e.g., a micropipette to transfer 5 μL of the stock solution into a small Eppendorf vessel and add 95 μL ethanol (spectroscopic quality). Keep the vessel closed and on ice during the experimental session to minimize evaporation.
-
5.
K2SO4 stock solution for membrane- potential calibration: To prepare 50 mL of a 3 M K2SO4 solution weigh 26.14 g of K2SO4 and dissolve in 40 mL of DD water. Fill the solution into a 50-mL graduated flask and make up to 50 mL with DD water. pH adjustment is not necessary. Split the volume in aliquots of 1 mL in separate Eppendorf vessels and keep them frozen at −24 °C until used.
3 Methods
3.1 Na,K-ATPase Liposomes
-
1.
Enzyme preparation: Na,K-ATPase is prepared from outer medulla of rabbit kidneys according to procedure C of Jørgensen [19] (see also Chap. 2). This method yields purified enzyme in the form of open membrane fragments that consist of about 0.6 mg phospholipids and 0.2 mg cholesterol per mg protein [19, 20]. More than 98 % of the ATPase activity can be inhibited by ouabain, and specific ATPase activity is between 1800 and 2300 μmol Pi per hour and mg protein at 37 °C. The ATPase activity is determined by the pyruvate/lactate dehydrogenase assay [21] or the Malachite green test [22] (see also Chaps. 10–12), and the protein concentration by the Lowry method [23]. Typical protein concentrations at the end of the purification procedure are 3–5 mg/mL.
-
2.
Determine the amount of enzyme to be solubilized: The amount of Na,K-ATPase applied for reconstitution controls the number of pump molecules reconstituted in the liposomes, and thus, the magnitude of the ion flux. Using an enzyme with a specific activity of 2000 μmol Pi per hour and mg protein at 37 °C, a reasonable flux for Oxonol VI experiments is obtained when one starts with an aliquot of purified membrane fragments that contains 300 μg Na,K-ATPase.
-
3.
The enzyme suspension (about 100 μL) is centrifuged in an appropriate centrifuge for small volumes at ~160,000 × g for 15 min.
-
4.
Aspirate the supernatant with a micropipette and discard it (note the volume and calculate the volume of the pellet!).
-
5.
Add an aliquot of the cholate buffer to the pellet so that the protein concentration is 2 mg/mL (see Note 1 ).
-
6.
To homogenize the protein suspension, pipet the contents up and down 10 times with a micropipette in the centrifuge tube.
-
7.
Let the cholate react with the membrane fragment for 10 min at room temperature in the centrifuge tube.
-
8.
Centrifuge the suspension again under the same conditions as given above.
-
9.
After centrifugation, three phases are visible in the centrifugation tube: a pellet of undissolved membrane fragments, a slightly turbid layer floating above the pellet, and a major clear supernatant. Only both liquid layers are collected together (~140–145 μL). They contain the solubilized Na,K-ATPase . The pellet has to be avoided and can be discarded.
-
10.
Liposome formation: Mix all of the suspension of solubilized Na,K-ATPase with 100 μL cholate-containing lipid stock solution, vortex the mixture for several seconds.
-
11.
Transfer the mixture into a ca. 150 mm long pretreated dialysis tubing (see Note 2 ). The tubing is closed at both ends by a clamp or a knot.
-
12.
The tubing is immersed into at least 200 mL Dialysis buffer 1 and dialyzed for 72 h or longer under continuous gentle stirring (magnetic stirrer) at 4 °C. Longer periods of dialysis or an exchange of the Dialysis buffer 1 may slightly decrease the leak conductance of the liposomes. The enzyme activity is not affected by the duration once the liposomes are formed.
-
13.
After dialysis, the suspension is removed from the tubing by a micropipette with a long pipette tip.
-
14.
The volume is measured to check possible concentration or dilution of the liposome suspension. If the volume remained constant, the lipid concentration in the liposome preparation is ~8 mg/mL. The liposome suspension is kept in a 500 μL Eppendorf vessel.
-
15.
To determine the specific enzyme activity of the reconstituted ion pumps, enzyme activity and protein concentration may be determined (see Note 3 ). The specific activity of the reconstituted Na,K-ATPase is typically in the order of 500–600 μmol Pi per hour and mg protein at 37 °C when PC 18:1 is used as lipid (see Note 4 ).
-
16.
Keep the liposomes on ice for about 3 h before use. This treatment decreases the leak conductance of the liposome membrane.
-
17.
Liposome suspensions are stored at 4 °C (or on ice) and may be used for several days without significant loss of enzyme activity. Never freeze liposome suspensions because the formation of ice crystals affects the liposome suspension severely!
Detailed studies have shown that the liposome suspension consists of liposomes of different diameter and different number of ATPases reconstituted per liposome. This liposome heterogeneity affects the time course of the pump-induced fluxes across the membrane [7, 24, 25], which has to be taken into account for detailed discussion of the experiments. In the mentioned references, explicit calculations for fluorescence experiments are presented that may be used for further application.
3.2 Na,K-ATPase Liposomes for Membrane-Potential Calibration
-
1.
Perform steps 1–11 exactly as described in Subheading 3.1.
-
2.
The tubing is immersed into at least 200 mL Dialysis buffer R and dialyzed for 72 h or longer under continuous gentle stirring (magnetic stirrer) at 4 °C. Longer periods of dialysis or an exchange of the Dialysis buffer 1 may slightly decrease the leak conductance of the liposomes.
-
3.
Follow steps 13–17 as described in Subheading 3.1 (see Note 5 ).
3.3 KdpFABC Liposomes
-
1.
Enzyme preparation: The C-terminally His14-tagged KdpFABC complex is expressed in E. coli as described previously [15]. The enzyme complexes are solubilized with β-DDM, and further purified using affinity chromatography. Subunit composition is analyzed on 12.5 % SDS -PAGE gel. The protein concentration is determined by the Lowry method [23], and typical protein concentrations at the end of the purification procedure are 2–5 mg/mL. ATPase activity is measured using the Malachite-green assay [22], and the specific activity is typically ~0.53 μmol Pi mg−1 min−1 in the presence of saturating K+ and ATP concentrations at 37 °C. The amount of protein needed for a single measurement is ~1 μg.
-
2.
To produce a liposome suspension for 1 day of measurements, take 120 μL of 25 mg/mL chloroform solution of E. coli lipids and vacuum-dry it under rotation in a glass flask.
-
3.
240 μL Dialysis buffer 2 are mixed with 60 μL of the Detergent stock solution mixture in an Eppendorf vessel to obtain 300 μL Dialysis buffer 2 supplemented with 2 % β-DDM and 2 % C12E8.
-
4.
The thin lipid film obtained at the wall of the glass surface is dissolved in the 300 μL supplemented Dialysis buffer 2 to a final lipid concentration of 10 mg/mL.
-
5.
The lipid/detergent mixture is sonicated under a nitrogen atmosphere (to prevent lipid peroxidation) and kept at room temperature until a clear solution is obtained, typically 2–3 h are sufficient.
-
6.
Dilute the detergent-solubilized KdpFABC to a final concentration of 2 mg/mL with Dialysis buffer 2.
-
7.
Mix 300 μL of 2 mg/mL KdpFABC and 300 μL of 10 mg/mL lipid/detergent solution to obtain a protein/lipid ratio of 1:5 (w/w) (see Note 6 ).
-
8.
Add to 200 mg of the pretreated Bio-Beads to remove the detergent (see Note 7 ).
-
9.
Leave the mixture in a sealed reaction vessel overnight under constant rotation at 40 rpm at 4 °C.
-
10.
Finally, the liposome suspension is separated from the sedimented beads using capillary tips.
-
11.
To minimize the leak conductance of the liposome membrane, the liposome suspension is kept on ice for about 3 h before starting the experiments. It is stored on ice during the experiments and is used only during the same day, since already after 24 h a leak conductance of the E. coli-lipid membranes is significantly increased.
The liposome diameter can be checked by dynamic light scattering (see Note 8 ). The ATPase activity of the reconstituted KdpFABC can be determined in the absence of detergents using, e.g., the malachite green assay. Under this condition only the activity of the inside-out oriented fraction of the KdpFABC complexes is measured due to the membrane impermeability to ATP . A typical ATPase activity is ~0.28 μmol Pi mg−1 min−1 in the presence of 70 mM K2SO4 and 5 mM MgSO4 at pH 7.2 and 37 °C. It has to be taken into account that approximately 50 % of the reconstituted pumps is oriented inside-out and contributes to the enzyme activity. Therefore, the apparently reduced enzyme activity is in good agreement with the twofold larger activity obtained from the detergent-solubilized enzyme.
3.4 Choice of the Fluorescent Dye
When ion fluxes across the liposome membrane have to be detected, a choice of the fluorescent dye has to be made with respect to the direction in which net charge is transported. If the liposome interior is charged up positively by the pump, as in the case of the Na,K-ATPase , an anionic dye, e.g., Oxonol VI , has to be chosen. If the interior is charged up negatively, as in the case of the KdpFABC complex, a cationic dye is needed, e.g., DiSC3(5). Due to the detection mechanism, the sensitivity of the dyes is rather low when used for experiments in which the respective opposite membrane potential is generated.
To minimize noise and disturbances of the fluorescence signals, the cuvettes and the micropipette tips have to be flushed prior use carefully with compressed clean air to make sure that all fluff and dust particles are removed that frequently adhere the surfaces due to electrostatic attraction.
3.5 Oxonol VI Experiments
-
1.
Experiments are performed in a fluorescence spectrophotometer with a thermostatically controlled cuvette holder equipped with a magnetic stirrer. Fluorescence cuvettes with a light-path length of 1 cm are used. A typical temperature for the experiments is 20 °C. The excitation wavelength is set to 580 nm (slit width 20 nm) and the emission wavelength to 660 nm (slit width 20 nm) with an integration time of 1 s.
-
2.
Take a bucket, fill it with crunched ice and have in it ready for use during the session:
-
(a)
Na,K-ATPase containing liposomes prepared in Dialysis buffer 1 (see Subheading 3.1).
-
(b)
About 100 μL of the 30 μM Oxonol VI solution in ethanol, prepared daily from stock solution (see Note 9 ).
-
(c)
40 μL Na2-ATP solution (250 mM). It is obtained by thawing an Eppendorf vessel containing 10 μL Na2-ATP stock solution (1 M), add 30 μL DD water and vortex the mixture.
-
(a)
-
3.
Take about 50 mL of the Measurement buffer, perform sterile filtration into a small glass flask that has been made dust free by blowing it with compressed air before filling.
-
4.
1 mL of measurement buffer is filled into a fluorescence cuvette together with a stirring magnet, placed into the cuvette holder and thermally equilibrated. (Depending on the thermal coupling between cuvette and cuvette holder this may need 3–10 min.)
-
5.
Start fluorescence recording before addition of Oxonol VI .
-
6.
Add 1 μL Oxonol VI solution and wait until a constant fluorescence signal is obtained (cf. Fig. 1).
Fig. 1 
Oxonol VI experiment with Na,K-ATPase -containing liposomes. To the thermally equilibrated 1 mL of measurement buffer, consecutively 1 μL Oxonol VI solution and 3 μL liposome suspension were added. The resulting fluorescence level is termed “F0” and used as reference to normalize the fluorescence which is measured in arbitrary units. Pump activity was started by addition of 2.5 μL Na2-ATP solution. After ~50 s a plateau level was reached that was stable for ~180 s before inset of a transition to a lower constant level that remained for at least 30 min. This transition was the consequence of an intra-liposomal depletion of K+ ions which caused a change of the Na,K-ATPase function from the normal Na-K mode to the so-called Na-only mode with a significantly lower pump rate. In this experiment the time resolution was 1 s, i.e., the fluorescence signal was averaged for 1 s per each point recorded. The temperature was 18 °C
-
7.
Add an appropriate amount of the Na,K-ATPase containing liposome suspension to obtain ~20 ng lipid in the cuvette (at 8 mg/mL lipid concentration it would be 2.5 μL). Wait until a constant fluorescence signal is obtained.
-
8.
Add 1 μL of the ATP solution to the ion pumping (see Note 10 ).
-
9.
This process is observable by a rapid increase of the fluorescence (Fig. 1). To obtain detailed information of the transport properties of the Na,K-ATPase , such experiments can be performed at varying substrate conditions such as the Na+ and K+ concentrations in the measurement buffer (or inside the liposome preparations), ATP concentration, buffer pH, and temperature. Examples may be found in various publications, e.g., [17, 18, 26].
-
10.
Fluorescence recording may be stopped after the elevated fluorescence level is constant for a few minutes.

3.6 DiSC3(5) Experiments
-
1.
Experiments are performed in a fluorescence spectrophotometer with a thermostatically controlled cuvette holder equipped with a magnetic stirrer. Fluorescence cuvettes with a light-path length of 1 cm are used. A typical temperature for the experiments is 18 °C. The fluorescence is excited at 650 nm (5 nm slit), and emission is detected at 675 nm (5 nm slit) with an integration time of 1 s.
-
2.
Take a bucket, fill it with crunched ice and have in it ready for use during the session:
-
(a)
KdpFABC containing liposome suspension prepared in Dialysis buffer 2 (see Subheading 3.3).
-
(b)
About 50 μL of the 300 μM DiSC3(5) solution in DMSO.
-
(c)
20 μL Na2-ATP solution (500 mM). It is obtained by thawing an Eppendorf vessel containing 10 μL Na2-ATP stock solution (1 M), add 10 μL DD water and vortex the mixture.
-
(d)
20 μL valinomycin solution (1 mM in ethanol).
-
(e)
50 μL of the 200 mM Na3VO4 solution.
-
(a)
-
3.
Take about 50 mL of the Dialysis buffer 2, perform sterile filtration into a small glass flask that has been made dust free by blowing it with compressed air before filling.
-
4.
1 mL of Dialysis buffer 2 is filled into a fluorescence cuvette together with a stirring magnet, placed into the cuvette holder and thermally equilibrated at 18.0 ± 0.1 °C. (Depending on the thermal coupling between cuvette and cuvette holder this may need 3–10 min.)
-
5.
Start fluorescence recording before addition of the liposome suspension.
-
6.
Add an aliquot of the liposome suspension corresponding to the final lipid concentration of 80 μg/mL.
-
7.
Shortly thereafter (~30 s) an aliquot of 1 mM DiSC3(5) is added, to obtain a dye concentration of 300 nM in the cuvette (see Note 11 ). After an initial, fast fluorescence increase a stable signal is achieved, typically within less than a minute.
-
8.
Add 1 μL of 0.5 M Mg-ATP solution to trigger the pump activity.
Extrusion of positive charge by the enzyme complexes generates an inside-negative potential, reflected in a fluorescence decrease (Fig. 2a), which approaches exponentially a steady-state level at which the pump current is compensated by the leak current due to the passive membrane conductance and the electric-potential gradient. Follow the signal until a constant fluorescence level is obtained.
Fig. 2 
Electrogenic pump activity of KdpFABC containing liposomes detected by the membrane-potential indicator DiSC3(5). Recording of the fluorescence began after the equilibration of an aliquot of liposomes (80 μg/mL) and 1 mM DiSC3(5) in 1 mL of Dialysis buffer 2. (a) The initial K+ concentration was 140 mM inside and outside. Addition of ATP triggers K+ pumping out of the liposomes. The increasing inside-negative potential is reflected by a fluorescence decrease. Addition of valinomycin induces a K+-selective conductance of the liposome membrane that short-circuits the pump activity, and the resulting steady-state fluorescence level attains to the Nernst potential (Eq. 1), which is controlled by the ratio of K+ concentrations inside and outside the liposomes. (b) When the ATP-induced steady state was reached, a non-saturating concentration of the inhibitor o-vanadate was added, and the membrane potential was reduced to a new steady-state level according to the reduced pump activity and the leak conductance of the membrane. Addition of valinomycin again leads to a fluorescence level representing the Nernst potential
-
9.
Add 1 μL of the valinomycin solution (final concentration is 1 μM) (see Note 12 ). This potassium ionophore causes a stepwise fluorescence increase to a level that represents the Nernst potential determined by the actual K+ concentration inside and outside the liposomes, according to Eq. 1.
-
10.
Alternatively, add 5 μL of the o-vanadate solution to a final concentration of 0.1 mM of the inhibitor. The result of the pump inhibition is an exponential increase of the fluorescence signal (Fig. 2b).
The time course can be used to evaluate the leak conductance of the liposome membrane. Extracting the time constant, τ, of the exponential increase allows the determination of the specific leak conductance of the membrane (see Equation 3 in Subheading 3.9). The average value of the specific leak conductance of E. coli-lipid membrane was determined to be 21 ± 1 nS/cm2 at pH 7.2. This parameter varied only insignificantly between different liposome preparations, and different pH of Dialysis buffer 2.
-
11.
Fluorescence recording may be stopped after the fluorescence level is constant for a few minutes.

3.7 Calibration of the Membrane Potential
-
1.
Introductory remarks: The mechanism of the slow-response dyes is a redistribution of the dye molecules between the inside and outside (or to be more precise: particularly between inner and outer layer) of the lipid bilayer. Because of this fact the fluorescence response of the dyes depends on various parameters such as the total dye concentration, the ratio of lipid and dye concentration in the cuvette, and the liposome size. Therefore, it is not possible to use a fixed calibration curve that relates fluorescence response and membrane potential for all liposome preparations. A reliable method to calibrate the membrane potential was introduced in 1974 by Hoffman and Laris [27].
The principle exploited by their method is that liposomes with a defined intravesicular K concentration, [K+]in, are added to a buffer of the K+ concentration [K+]out. In the presence of 1 μM valinomycin within seconds an electric potential, V, arises which corresponds to the K+ equilibrium (or Nernst) potential, E K, calculated according to
$$ V={E}_{\mathrm{K}}={\varphi}_{\mathrm{in}}-{\varphi}_{\mathrm{out}}=\frac{RT}{F}\cdot \ln \frac{{\left[{\mathrm{K}}^{+}\right]}_{\mathrm{out}}}{{\left[{\mathrm{K}}^{+}\right]}_{\mathrm{in}}} $$(1)where R = 8.31 J/(mol K) is the gas constant, T is the absolute temperature, F = 96,485 C/mol the Faraday constant.
-
2.
Choice of the sign of voltage: When inside-negative potentials shall be calibrated, liposomes should be prepared in 140 mM K+, whereas for inside-positive potential liposomes should be prepared in 1 mM K+ plus 149 mM of an inert cation such as Tris+ to maintain the same ionic strength (see Note 13 ). The K+ concentration on the outside will be varied between 1 mM and 140 mM.
To perform calibration experiments of inside-positive membrane potentials with Oxonol VI , see below steps 3–12. To perform calibration experiments of inside-negative membrane potentials with DiSC3(5), see below steps 13–22. The analysis of the calibration experiments is described in Subheading 3.9, step 2.
-
3.
Oxonol experiments are performed according to Subheading 3.5. In detail:
-
4.
Take a bucket fill it with crunched ice and have in it ready for use during the session:
-
(a)
Na,K-ATPase containing liposomes are prepared for membrane-potential calibration (see Subheading 3.2).
-
(b)
About 100 μL of the 30 μM Oxonol VI solution in ethanol, prepared daily from stock solution (see Note 9 ).
-
(c)
200 μL of a 50 μM valinomycin solution (take 10 μL of the 1 mM stock solution transfer it into an Eppendorf vessel and add 190 μL ethanol of spectroscopic quality).
-
(d)
1 mL of 3 M K2SO4 solution.
-
(e)
1 mL of 300 mM K2SO4 solution which is obtained by transferring 100 μL of the 3 M K2SO4 solution into an Eppendorf vessel, adding 900 μL DD water and vortexing the solution.
-
(a)
-
5.
Take about 50 mL of the Dialysis buffer R, perform sterile filtration into a small glass flask that has been made dust free by blowing it with compressed air before filling.
-
6.
1 mL of Dialysis buffer R is filled into a fluorescence cuvette together with a stirring magnet, placed into the cuvette holder and thermally equilibrated (3–10 min).
-
7.
Start fluorescence recording before addition of Oxonol VI .
-
8.
Add 1 μL Oxonol VI solution and wait until a constant fluorescence signal is obtained.
-
9.
Add an appropriate amount of the Na,K-ATPase containing liposome suspension to obtain ~20 ng lipid in the cuvette (at 8 mg/mL lipid concentration it would be 2.5 μL). Wait until a constant fluorescence level is obtained.
-
10.
Add 1 μL of the valinomycin solution. (In some cases the addition of valinomycin causes a small change in the fluorescence intensity despite that fact that inside and outside electrolytes of the liposomes have the same composition and the membrane potential is 0. This is an artifact, and the F 0 level for normalization has to be taken after addition of valinomycin.)
-
11.
Aliquots of the K2SO4 solutions are added which cause a rapid fluorescence increase because, according to Eq. 1, the elevated K+ concentration induces an inside-positive potential (see Note 14 ). Between additions, an appropriate waiting time has to be chosen to be able to determine resulting fluorescence level.
-
12.
Fluorescence recording is stopped after the final fluorescence level is obtained and remains stable.
-
13.
DiSC3(5) experiments are performed accordingly to Subheading 3.6. In detail:
-
14.
Take a bucket fill it with crunched ice and have in it ready for use during the session:
-
(a)
KdpFABC containing liposomes (see Subheading 3.3).
-
(b)
About 50 μL of the 300 μM DiSC3(5) solution in DMSO.
-
(c)
50 μL valinomycin of the 1 mM stock solution.
-
(d)
1 mL of 3 M K2SO4 solution.
-
(e)
1 mL of 300 mM K2SO4 solution which is obtained by transferring 100 μL of the 3 M K2SO4 solution into an Eppendorf vessel, adding 900 μL DD water and vortexing the solution.
-
(a)
-
15.
Take about 50 mL of the Measurement buffer L, perform sterile filtration into a small glass flask that has been made dust free by blowing it with compressed air before filling.
-
16.
1 mL of Measurement buffer L is filled into a fluorescence cuvette together with a stirring magnet, placed into the cuvette holder and thermally equilibrated.
-
17.
Start fluorescence recording before addition of the liposome suspension.
-
18.
Add an aliquot of the liposome suspension corresponding to the final lipid concentration of 80 μg/mL.
-
19.
Shortly thereafter (~30 s) an aliquot of 1 mM DiSC3(5) is added, to obtain a dye concentration of 300 nM in the cuvette. After an initial, fast fluorescence increase a stable signal is achieved, typically within less than a minute.
-
20.
Add 1 μL of the 1 mM valinomycin solution. Wait until a steady-state fluorescence is reached (see Note 15 ).
-
21.
Aliquots of the K2SO4 solutions are added which cause a rapid fluorescence increase because, according to Eq. 1, the elevated K+ concentration reduces the inside-negative potential. Between additions, an appropriate waiting time has to be chosen to be able to determine resulting fluorescence level (see Note 16 ).
-
22.
Fluorescence recording is stopped after the last fluorescence level is obtained.
3.8 Inhibition of P-Type ATPases by o-Vanadate
-
1.
Introductory remarks: P-type ATPase s can be effectively inhibited from the cytoplasmic side by o-vanadate, which acts as a transition-state analog of phosphate. o-Vanadate binds in the presence of Mg2+ to the dephosphorylated E2 state with a high affinity in the micromolar concentration range. Since in the case of ATPases reconstituted in liposomes, only those pumps that face the outside with their cytoplasmic side are activated by ATP , they may be easily inhibited by o-vanadate. While the binding affinity for o-vanadate in isolated enzyme preparations is in the order of 1–10 μM, it was found that the (apparent) binding affinity of the enzymes reconstituted in liposomes is significantly lower. Therefore, it is important to determine the precise half-inhibition constant, K I, which can be derived from the enzyme activity in the presence of various o-vanadate concentrations between 0 and 5 mM.
-
2.
Determine the ATPase activity by the pyruvate/lactate dehydrogenase assay for the Na,K-ATPase or the Malachite green test for the KdpFABC in the presence of different o-vanadate concentrations.
-
3.
Plot the enzyme activity against the applied o-vanadate concentration.
-
4.
Fit the dependence of the enzyme activity, E A, on the o-vanadate concentration, c van, by a Michaelis–Menten curve which provides K I as half-inhibiting constant.
$$ {E}_{\mathrm{A}}\left({c}_{\mathrm{van}}\right)={E}_{\mathrm{A}}^{\max}\cdot \frac{K_{\mathrm{I}}}{K_{\mathrm{I}}+{c}_{\mathrm{van}}} $$(2) -
5.
For the inhibition experiments with liposomes, a concentration of ~30 · K I should be chosen. Under this condition ~97 % of the enzyme is inhibited and the residual pump activity is no longer significant.
-
6.
Perform an Oxonol VI experiment as described in Subheading 3.5, steps 1–8. After a constant fluorescence level is obtained, add a maximal-inhibiting amount of o-vanadate (e.g., 2 mM). The fluorescence signal will decay exponentially to V = 0. When the fluorescence is constant, the recording is stopped. An example is shown in Fig. 3.
Fig. 3 
Oxonol VI experiment with Na,K-ATPase -containing liposomes showing the discharge of the membrane capacitor upon inactivation of the ion pumps by o-vanadate as indicated by the decreasing fluorescence (i.e., membrane potential). The temperature was 12 °C

3.9 Analysis of Fluorescence Experiments
-
1.
Normalization: The amplitude of the fluorescence signals is an extensive state variable, i.e., it depends on the amount of dye and liposomes added to the cuvette. Since the added volumes are in the order of μL, small but nevertheless significant variations of the additions may occur between different experiments and thus affect the fluorescence amplitude. Therefore, the fluorescence traces have to be normalized to allow a direct comparison between various experiments. This is achieved by relating the fluorescence changes to the specific initial experimental condition, when only the dye and the liposomes are in the cuvette. The corresponding fluorescence level is termed F 0 (see Fig. 1). The normalized fluorescence signal, F(t)norm, is then calculated by:
$$ F{(t)}_{\mathrm{norm}}=\frac{F(t)-{F}_0}{F_0} $$(3)By this normalization method, the fluorescence level is 0 before the addition of ATP (or any other substrate).
-
2.
Calibration of the membrane voltage: The fluorescence signals in experiments obtained according to Subheading 3.7 are normalized (see Eq. 3). The normalized fluorescence levels of each K+ concentration is plotted against the calculated respective Nernst potential (Eq. 1). Examples of such a voltage calibration are shown for Oxonol VI in Fig. 4 and for DiSC3(5) in Fig. 5. These plots allow the conversion of fluorescence into voltage.
Fig. 4 
Fluorescence –voltage calibration of Na,K-ATPase containing liposomes with Oxonol VI . Under the condition of 30 nM Oxonol VI and 20 μg/mL lipid, a linear calibration line is obtained which allows a simple conversion of fluorescence into membrane voltage. The solid line represents a linear regression with a slope of 0.0115 mV−1 and an ordinate intercept of −0.02. For comparison, a cubic regression line is added as dotted line to show that deviations from the linearity are not significant. The results of three experiments with different intra-lamellar K+ concentrations are combined
Fig. 5 
Calibration of the fluorescence responses of DiSC3(5) dye. Lipid vesicles without reconstituted KdpFABC pumps loaded with 140 mM K+ were added to buffer containing 0.14 mM K+. After equilibration, 1 μM valinomycin and subsequently aliquots of K2SO4 were added. The equilibrium potential, V, was calculated at each K+ concentration according to Eq. 1 from both K+ concentrations, inside and outside, and the fluorescence levels were plotted against the respective value of V. The dashed regression line indicates the range of a linear voltage–fluorescence relation
In the presence of a lipid concentration of 20 μg/mL and 30 nM Oxonol VI, the calibration curve is almost linear in the voltage range between 0 and 100 mV [17]. With a linear calibration curve the membrane potential has not to be read from a best-fit curve through the experimental data but can be directly calculated. For the experimental data of Fig. 4, it would be (according to the equation of a line):
$$ V=\frac{\varDelta F/{F}_0+0.02}{0.0115}\mathrm{mV} $$(4)Negative membrane potentials: In the case of the DiSC3(5) experiments, linearity of the calibration curve is obtained in the voltage range between −40 and −120 mV (Fig. 5). At low voltages (V > −30 mV), the sensitivity of this dye is poor.
-
3.
Determination of the leak conductance: The leak conductance of liposome membranes can be easily determined when the pump activity has been started by ATP and the steady-state membrane potential is obtained. In this state, the ion pumps are completely inhibited by addition of 2 mM o-vanadate. Under this condition only passive ion transport, namely the leak current, preferentially of K+ ions, is observed which will degrade the membrane potential eventually to zero.
The fluorescence amplitude, which is proportional to the membrane potential, decays exponentially and can be fitted by the function, F(t) = ΔF max · exp(−t/τ). The characteristic time constant, τ, carries information on the specific leak conductance of the membrane. (The fact that the fluorescence amplitude drops below the starting value may be the result of a change of the interfacial potential of the membrane surface by o-vanadate binding to the lipid head groups, as reflected by the fast fluorescence step upon o-vanadate addition.) The calculation of the specific leak conductance is based on following considerations. When the pumps are inhibited, the liposome membrane can be treated as a parallel connection of the membrane capacitance, C m, and the leak conductance, G m. Since the membrane potential, V m, is different from zero, a discharge of the membrane capacitor is observed, which is described, according to physics textbooks, as:
$$ {V}_{\mathrm{m}}(t)={V}_{\max}\cdot \exp \left(-\frac{t}{\tau}\right);\kern0.24em \tau =\frac{C_{\mathrm{m}}}{G_{\mathrm{m}}} $$(5)Since the specific membrane capacitance, C m, is a constant, commonly ~1 μF/cm2, without significant changes for all lipid membranes, the specific leak conductance can be determined as G m = C m/τ. With the characteristic time constant of ~200 s in the experiment shown in Fig. 3, G m is 1 (μF/cm2)/200 s = 5 nS/cm2.
-
4.
Initial slope analysis: When the fluorescence signals are recorded with a time resolution of 0.1 s (or faster), it is possible to obtain detailed information on the pump currents, I P, generated by the ATPases in the liposome membrane. The following prescription is given for the Na,K-ATPase , however, it can be applied also to the KdpFABC complex in liposomes [28] or other reconstituted electrogenic ATPases. When ATP is added, the ATPases start to pump simultaneously, and in the beginning, i.e., before a considerable membrane potential is build up and the K+ concentration in the liposomes becomes altered significantly, the pump is controlled by the rate-limiting reaction step of the pump cycle, which is Na+ binding at low Na+ concentrations, and the conformation transition, (Na3)E1-P → P-E2Na3 at saturating Na+ concentrations.
To study the substrate dependence of the pump current, the following system properties have to be exploited. The equivalent circuit diagram of the liposome membrane can be represented as shown in Scheme 1. The lipid bilayer has the capacitance, C m, and the leak conductance, G m. The ion pumps are represented as current generator, I P.
Scheme 1 
Equivalent circuit of the liposome membrane. The membrane can be represented by a parallel connection of the membrane capacitance, C m, the membrane conductance, G m, and the current generator (ion pumps) that generates the current, I p.
According to basic physics, these elements may be linked up in the following way:
$$ Q={C}_{\mathrm{m}}\cdot V;\kern0.24em I=\frac{\mathrm{d}Q}{\mathrm{d}t}={C}_{\mathrm{m}}\cdot \frac{\mathrm{d}V}{\mathrm{d}t}, $$(6)where Q is the electric charge on the capacitor, V the electric potential across the membrane, and I the current flowing across the membrane. The net current, I, is the sum of two components, the pump current, I P, and the leak current, I L, both flowing in opposing directions,
$$ I={I}_{\mathrm{P}}-{I}_{\mathrm{L}}={n}_{\mathrm{P}}\cdot {v}_{\mathrm{P}}\cdot {z}_{\mathrm{P}}\cdot {\mathrm{e}}_0-{G}_{\mathrm{m}}\cdot V $$(7)where n P is the number of Na,K-ATPase s in the liposome membrane, v P is the pump rate, z P is the number of charges transferred per pump cycle (= 1 in the case of the Na,K-ATPase), and e 0 is the elementary charge. G m is the leak conductance of the liposome. Combining Eqs. 6 and 7 leads to an inhomogeneous differential equation,
$$ \frac{\mathrm{d}V}{\mathrm{d}t}=\frac{I_{\mathrm{P}}}{C_{\mathrm{m}}}-\frac{G_{\mathrm{m}}}{C_{\mathrm{m}}}\cdot V $$(8)It is solved with the boundary condition that at long times, t → ∞, I = 0. This leads to:
$$ I={I}_{\mathrm{P}}-{I}_{\mathrm{L}}=0\kern0.24em \mathrm{and} $$(9)$$ {I}_{\mathrm{P}}^{\infty }={G}_{\mathrm{m}}\cdot {V}_{\infty } $$(10)where V ∞ is the stationary voltage level at which the pump current, I P, is compensated by the leak current. The solution of the differential equation is then:
$$ V(t)={V}_{\infty}\cdot \left(1- \exp \left(-\frac{t}{\tau}\right)\right);\kern0.24em \tau =\frac{C_{\mathrm{m}}}{G_{\mathrm{m}}};\kern0.24em {V}_{\infty }=\frac{I_{\mathrm{P}}^{\infty }}{G_{\mathrm{m}}} $$(11)It has been shown that the (normalized) fluorescence of Oxonol VI in liposome experiments, ΔF/F 0, is proportional to the membrane potential built up by the Na,K-ATPase [17]. Therefore, the function in Eq. 11 may be used to fit the time course of the fluorescence signal upon addition of ATP .
During the initial phase of the experiments the substrate concentrations do not change significantly and the electric potential across the membrane is still small so that v P may be assumed to be constant, and the pump current, I P, is then constant too. Therefore, the initial slope of the fluorescence signal contains information on the pump current,
$$ {\left(\frac{\mathrm{d}V}{\mathrm{d}t}\right)}_{t=0}={V}_{\infty}\cdot \frac{1}{\tau}\cdot \exp \left(-\frac{t}{\tau}\right)\Big|{}_{{}_{t=0}}=\frac{V_{\infty }}{\tau }=\frac{1}{C_{\mathrm{m}}}\cdot {I}_{\mathrm{P},t=0} $$(12)$$ {\left(\frac{\mathrm{d}{F}_{\mathrm{norm}}}{\mathrm{d}t}\right)}_{t=0}={K}^{*}\cdot {\left(\frac{\mathrm{d}V}{\mathrm{d}t}\right)}_{t=0}=\frac{K^{*}}{C_{\mathrm{m}}}\cdot {I}_{\mathrm{P},t=0} $$(13)Both equations may be combined to obtain a conditional equation for I P:
$$ {I}_{\mathrm{P},t=0}=\frac{C_{\mathrm{m}}}{K^{*}}\cdot \frac{F_{\mathrm{norm},\infty }}{\tau }={K}^{\#}\cdot \frac{F_{\mathrm{norm},\infty }}{\tau } $$(14)The initial pump current, I P, t=0, is therefore directly proportional to the initial slope of the fluorescence signal, (dF norm/dt) t=0. The proportionality constant, K #, in Eq. 14 depends on the physical and chemical properties of the specific liposome preparation and it is invariable within the same preparation. Therefore, the results obtained from the same liposome preparation can be directly compared, at least within a time period in which no aging processes modify the enzyme activity. A fit of Eq. 11 to the ATP -induced fluorescence change of an experiment similar to Fig. 1 is shown in Fig. 6. An application of this method of analysis can be found in refs. 28, 29.
Fig. 6 
Analysis of the ATP -induced Oxonol VI fluorescence increase upon addition of ATP to the Na,K-ATPase -containing liposome suspension. The fluorescence trace has been fitted with the function of Eq. 11, shown as solid curve. The initial slope (dashed line) is indicated in addition
-
5.
Fluorescence –voltage transformation: This step of analysis is exemplified for an experiment with Na,K-ATPase containing liposomes with the Oxonol VI approach. The time course of the fluorescence signal was recorded under the experimental condition of 20 μg/mL lipid and 30 nM Oxonol VI after the addition of 80 μM/mL Na2-ATP . The fluorescence signal was normalized according to Eq. 3 and plotted against time (Fig. 7).
Fig. 7 
Fluorescence –voltage transformation of Oxonol VI fluorescence. The digitized fluorescence trace is plotted against time. The left ordinate, ΔF/F 0, represents the normalized fluorescence. The right ordinate represents the respective membrane potential calculated according to Eq. 4
The experimental condition of Fig. 7 allowed the use of the fluorescence–voltage relation shown in Fig. 4 and quantified in Eq. 4 to calculate the membrane potential built up by the ion pump across the liposome membrane. In this liposome preparation, the maximal potential, i.e., when pump and leak current balance each other, was ~120 mV. During the first 2–3 s, a delayed increase of the fluorescence can be observed which is caused by the mixing process of the 4 μL of 20 mM ATP added to the 1 mL solution in the fluorescence cuvette stirred by a magnetic stirrer.
-
6.
Determination of the current–voltage curves: Current –voltage (or I–V) curves of the ion pumps contain important information on the mechanism of ion transporters. Those I–V curves are typically measured by electrophysiological experiments with whole cells. In native membranes, in which numerous ion transporters are present, I–V curves have to be determined by subtracting the current contribution of all other transporters. Typically, this is obtained by performing the experiment without and with a specific pump inhibitor. The pump-specific action is calculated as the difference between both signals.
An experiment as shown in Fig. 7 can be used to determine directly the I–V curve of the ion pump in the voltage range up to the maximal voltage without having to deal with other ion transporters. As has been discussed in detail in the literature, the number of pumps reconstituted in a single liposome varies around a mean value, and this value has to be determined from electron microscopic images [25]. Since, however, the number of ion pumps per liposome and the membrane area of the liposome, A, are voltage independent, a “mean” I–V curve can easily be calculated without knowing the number of active pumps reconstituted per liposome, n P. Based on Eqs. 6 and 7, one obtains an equation that expresses the voltage dependence of the pump rate, v p(V), as function of parameters provided by the experiment:
$$ {n}_{\mathrm{p}}\cdot {v}_{\mathrm{P}}(V)=\frac{A}{z_{\mathrm{P}}\cdot {\mathrm{e}}_0}\cdot \left({C}_{\mathrm{m}}\cdot \frac{\mathrm{d}V}{\mathrm{d}t}+{G}_{\mathrm{m}}\cdot V\right) $$(15)Since the number of pumps, n p, is constant (although unknown), the voltage dependence of the product n p · v p is studied. A is the area of the liposome membrane. For Na,K-ATPase-containing liposomes produced by dialysis a typical radius is R = 45 nm [7], therefore A = 4π · R 2 = 2.54 × 10⁻¹⁰ cm2. The specific capacitance is 1 μF/cm2, and the leak conductance G m = 5 nS/cm2 (see step 3 in Subheading 3.9). The number of elementary charges, e 0, translocated per pump cycle is z p = 1. At each given data point, i, in Fig. 7 the voltage V i is known after the fluorescence–voltage transformation, and the slope of the voltage, dV/dt, can be calculated. To reduce the noise of the resulting data, the mean of the slope before and after data point i is taken
$$ \frac{\mathrm{d}{V}_i}{\mathrm{d}t}=\frac{1}{2}\left[\frac{V_i-{V}_{i-1}}{t_i-{t}_{i-1}}+\frac{V_{i+1}-{V}_i}{t_{i+1}-{t}_i}\right] $$(16)Using the numbers of V i and (dV i /dt), and the constants given above, n p · v p can be calculated for each V i according to Eq. 16 and plotted against V i (Fig. 8).
Fig. 8 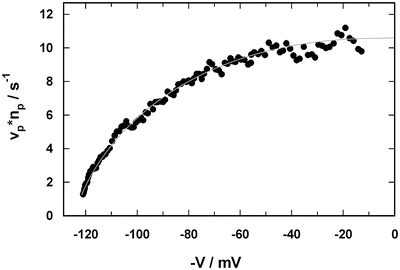
Current –voltage dependence of the Na,K-ATPase determined from the fluorescence signal shown in Fig. 7. The grey line drawn through the data points is included to guide the eye
Due to the mixing period of ~3 s at the beginning of the fluorescence experiment (Fig. 7), the I/V curve cannot be determined for small voltages. However, in this voltage range no significant voltage dependence is expected, and the value of n p · v p can be extrapolated to V = 0.


4 Notes
-
1.
Example: When you work with membrane fragments of 4 mg/mL protein concentration, you have to take 75 μL to get 300 μg protein. After centrifugation you remove with a micropipette say 70 μL not to disturb the pellet. To obtain a final protein concentration of 2 mg/mL, the 300 μg protein have to be dissolved in 150 μL cholate buffer. Since the pellet has already 5 μL, one has to add 145 μL cholate buffer.
-
2.
The dialysis tubing has a nominal dry wall thickness of 50 μm and a pore diameter of approximately 25 Å. To prepare the delivered dry and glycerol-treated tubing, a piece of ~1 m length is boiled for 30 min in 10 mM EDTA at pH 7.5. Then it is stored in 1 mM EDTA, pH 7.5, at 4 °C in a closed glass flask. For a dialysis, pieces of appropriate lengths are cut off. To avoid contamination of the remaining tubing, it is always touched only with gloves.
-
3.
To determine the protein concentration of the Na,K-ATPase reconstituted in liposomes the Markwell method has to be used [30], which is a modified Lowry assay with sodium dodecyl sulfate (SDS ).
-
4.
The final activity depends significantly on the lipid composition of the membrane [31]. In addition, it has to be taken into account that only half of the reconstituted pumps are oriented cytoplasmic side out and the other half in opposite orientation. The latter is not accessible by ATP , and therefore, does not contribute to the measured enzyme activity.
-
5.
The enzyme activity in this preparation cannot be determined accurately because the pumps are unable to perform the Na,K-mode due to the low internal K+ concentration.
-
6.
The lipid/protein ratio affects the size of the formed proteoliposomes and the actual protein reconstitution, and it has to be individually optimized. For the purposes of experiments performed with reconstituted KdpFABC in our lab, the most suitable protein/lipid ratio was found to be 1:5 (w/w), which results in high fluorescence responses and a stable enzyme activity, lasting for about 1 day.
-
7.
To pre-equilibrate Bio-Beads add 600 μL Dialysis buffer 2 to 200 mg of Bio-Beads, incubate for 30 min at room temperature. The buffer above the sedimented beads is removed before use by aspiration with a pipette and capillary tips.
-
8.
Dynamic light scattering measurements are performed at room temperature, using a DLS Viscotek 802 spectrometer. Liposomes are diluted to achieve a final concentration of approximately 0.1 mg of lipid/mL of buffer, filtered with a 0.45 μm PVDF centrifugal filter (Millipore), and transferred to a 12 μL square cuvette (Viscotek, 802DLS quartz cell). Distilled water and Dialysis buffer 2 are filtered with 0.02 μm inorganic membrane filters (Whatman). Intensity distributions of the scattered light are recorded and analyzed with the program Omnisize (V. 2.0) to obtain the corresponding liposome diameters distribution. Typical liposome diameters are 117 ± 21 nm (SD) under the condition described.
-
9.
To obtain the 30 μM working solution, 3 μL of the oxonol VI stock solution are pipetted into a black 500 μL Eppendorf vessel to which 97 μL ethanol (spectroscopic quality) are added. The effective concentration can be checked spectroscopically. The molar extinction coefficient is 136,000 cm−1 M−1. The vessel is kept on ice during the experimental session. It is discarded at the end of the day. If no black Eppendorf vessel is available, the used vessel has to be wrapped in aluminum foil to prevent bleaching effects of the light in the lab.
-
10.
A concentration of 250 μM in the cuvette is sufficient to make sure that ATP does not become limiting even for experiments lasting more than 30 min.
-
11.
Both absorption and emission spectra of DiSC3(5) depend on solvent, ionic strength, and concentration of the dye. Due to the mechanism of the potential detection, the DiSC3(5) dye should be added to the liposome suspension (and not vice versa). In this manner, a constant fluorescence signal is reached already after 50 s, and a slow redistribution of the dye between non-fluorescent dye aggregates in the aqueous phase and the membranes is avoided. To minimize dye aggregation, it is essential to use the lowest amount of the dye that produces an acceptably large and stable signal. This should be tested in the used setup by checking various dye concentrations.
-
12.
A limitation of the application of DiSC3(5) consists in the interaction with a number of compounds commonly used as ionophores, including CCCP and dinitrophenol, which tend to produce non-fluorescent complexes with the dye [32, 33]. Valinomycin produces only minor artifacts.
-
13.
When the condition of very low K+ concentration in the liposomes is chosen, it has to be taken into account that the liposome volume is in the order of 4 × 10⁻¹⁸ L, and therefore, the number of K+ ions is only in the order of a thousand or less. When the K+ equilibrium potential is generated, the uptake of K+ may increase significantly the K+ concentration in the liposomes and has to be considered. The prescription for a correct calculation of very low initial K+ concentrations at the Nernst equilibrium is provided in ref. 17.
-
14.
According to Eq. 1, the Nernst potential can be calculated from the initial K+ concentration in the liposomes and the actual K+ concentration in the external solution. The following table provides some examples of K2SO4 additions and the calculated membrane potential. It is based on the initial condition of 1 mL buffer with 1 mM K+ in the cuvette and liposomes containing 1 mM K+.
Addition of K2SO4
[K+]out / mM
V m / mV
1 μL 0.3 M
1.6
11.9
2 μL 0.3 M
2.2
19.9
3 μL 0.3 M
2.8
26.0
4 μL 0.3 M
3.4
30.9
5 μL 0.3 M
4.0
35.0
1 μL 3 M
7.0
49.1
2 μL 3 M
13.0
64.7
5 μL 3 M
31.0
86.7
10 μL 3 M
61.0
103.7
-
15.
This fluorescence level corresponds to the maximum inside-negative membrane potential. According to Eq. 1, under the initial condition of [K+]in = 140 mM and [K+]out = 0.14 mM, at 18 °C a Nernst potential, E K, of −173 mV is obtained (Eq. 1).
-
16.
To restrict the volume of K2SO4 additions and avoid significant dilution effects that would have to be corrected numerically, the experiments can be started also in buffers containing initially, e.g., [K+]out = 1.4 or 14 mM.
References
Goldin SM, Tong SW (1974) Reconstitution of active transport catalyzed by the purified sodium and potassium ion-stimulated adenosine triphosphatase from canine renal medulla. J Biol Chem 249:5907–5915
Anner BM, Lane LK, Schwartz A, Pitts BJR (1977) A reconstituted Na++K+ pump in liposomes containing purified (Na++K+)-ATPase from kidney medulla. Biochim Biophys Acta 467:340–345
Karlish SJD, Pick U (1981) Sidedness of the effects of sodium and potassium ions on the conformational state of the sodium-potassium pump. J Physiol 312:505–529
Brotherus JR, Jacobsen L, Jørgensen PL (1983) Soluble and enzymatically stable (Na+ + K+)-ATPase from mammalian kidney consisting predominantly of protomer αβ-units. Preparation, assay and reconstitution of active Na+, K+ transport. Biochim Biophys Acta 731:290–303
Cornelius F, Skou JC (1984) Reconstitution of (Na++K+)-ATPase into phospholipid vesicles with full recovery of its specific activity. Biochim Biophys Acta 772:357–373
Forbush B III (1984) An apparatus for rapid kinetic analysis of isotopic efflux from membrane vesicles and of ligand dissociation from membrane proteins. Anal Biochem 140:495–505
Apell H-J, Marcus MM, Anner BM, Oetliker H, Läuger P (1985) Optical study of active ion transport in lipid vesicles containing reconstituted Na K-ATPase. J Membr Biol 85:49–63
Fürst P, Solioz M (1986) The vanadate-sensitive ATPase of Streptococcus faecalis pumps potassium in a reconstituted system. J Biol Chem 261:4302–4308
Fendler K, Drose S, Altendorf K, Bamberg E (1996) Electrogenic K+ transport by the Kdp-ATPase of Escherichia coli. Biochemistry 35:8009–8017
Anner BM, Moosmayer M (1981) Preparation of Na, K-ATPase-containing liposomes with predictable transport properties by a procedure relating the Na, K-transport capacity to the ATPase activity. J Biochem Biophys Meth 5:299–306
Forbush B III (1984) Na+ movement in a single turnover of the Na pump. Proc Natl Acad Sci U S A 81:5310–5314
Anner BM, Marcus MM, Moosmayer M (1984) Reconstitution of Na, K-ATPase. In: Azzi A, Brodbeck U, Zahler P (eds) Enzymes, receptors and carriers of biological membranes – a laboratory manual. Springer, Heidelberg, pp 81–96
Goldshlegger R, Karlish SJ, Rephaeli A, Stein WD (1987) The effect of membrane potential on the mammalian sodium-potassium pump reconstituted into phospholipid vesicles. J Physiol 387:331–355
Clarke RJ, Apell H-J (1989) A stopped-flow kinetic study of the interaction of potential-sensitive oxonol dyes with lipid vesicles. Biophys Chem 34:225–237
Damnjanovic B, Weber A, Potschies M, Greie JC, Apell H-J (2013) Mechanistic analysis of the pump cycle of the KdpFABC P-type ATPase. Biochemistry 52:5563–5576
Bashford CL, Chance B, Smith JC, Yoshida T (1979) The behavior of oxonol dyes in phospholipid dispersions. Biophys J 25:63–85
Apell H-J, Bersch B (1987) Oxonol VI as an optical indicator for membrane potentials in lipid vesicles. Biochim Biophys Acta 903:480–494
Clarke RJ, Apell H-J, Läuger P (1989) Pump current and Na+/K+ coupling ratio of Na+/K+-ATPase in reconstituted lipid vesicles. Biochim Biophys Acta 981:326–336
Jørgensen PL (1974) Isolation of (Na++K+)-ATPase. Meth Enzymol 32:277–290
Jørgensen PL (1982) Mechanism of the Na+, K+ pump. Protein structure and conformations of the pure (Na++K+)-ATPase. Biochim Biophys Acta 694:27–68
Schwartz AK, Nagano M, Nakao M, Lindenmayer GE, Allen JC (1971) The sodium- and potassium-activated adenosinetriphosphatase system. Meth Pharmacol 1:361–388
Vagin O, Denevich S, Munson K, Sachs G (2002) SCH28080, a K + -competitive inhibitor of the gastric H, K-ATPase, binds near the M5–6 luminal loop, preventing K+ access to the ion binding domain. Biochemistry 41:12755–12762
Lowry OH, Rosebrough AL, Farr AL, Randall RJ (1951) Protein measurement with the Folin phenol reagent. J Biol Chem 193:265–275
Apell H-J, Marcus MM (1985) Effects of vesicle inhomogeneity on the interpretation of flux data obtained with reconstituted Na, K-ATPase. In: Glynn J, Ellory C (eds) The sodium pump. The Company of Biologists Ltd., Cambridge, pp 475–480
Apell H-J, Läuger P (1986) Quantitative analysis of pump-mediated fluxes in reconstituted lipid vesicles. Biochim Biophys Acta 861:302–310
Apell H-J, Häring V, Roudna M (1990) Na, K-ATPase in artificial lipid vesicles. Comparison of Na, K and Na-only pumping mode. Biochim Biophys Acta 1023:81–90
Hoffman JF, Laris PC (1974) Determination of membrane potentials in human and Amphiuma red blood cells by means of fluorescent probe. J Physiol 239:519–552
Damnjanovic B, Apell H-J (2014) KdpFABC reconstituted in E. coli lipid vesicles: substrate dependence of the transport rate. Biochemistry 53(35):5674–5682
Cirri E, Kirchner C, Becker S, Katz A, Karlish SJ, Apell H-J (2013) Surface charges of the membrane crucially affect regulation of Na, K-ATPase by phospholemman (FXYD1). J Membr Biol 246:967–979
Markwell MA, Haas SM, Bieber LL, Tolbert NE (1978) A modification of the Lowry procedure to simplify protein determination in membrane and lipoprotein samples. Anal Biochem 87:206–210
Marcus MM, Apell H-J, Roudna M, Schwendener RA, Weder HG, Läuger P (1986) (Na++ K+)-ATPase in artificial lipid vesicles: influence of lipid structure on pumping rate. Biochim Biophys Acta 854:270–278
Waggoner AS (1979) Dye indicators of membrane potential. Annu Rev Biophys Bioeng 8:47–68
Bashford CL (1981) The measurement of membrane potential using optical indicators. Biosci Rep 1:183–196
Acknowledgement
This work was supported by the Konstanz Research School Chemical Biology, University of Konstanz, Germany, and the University of Konstanz (AFF 4/68).
Author information
Authors and Affiliations
Corresponding author
Editor information
Editors and Affiliations
Rights and permissions
Copyright information
© 2016 Springer Science+Business Media New York
About this protocol
Cite this protocol
Apell, HJ., Damnjanovic, B. (2016). Assaying P-Type ATPases Reconstituted in Liposomes. In: Bublitz, M. (eds) P-Type ATPases. Methods in Molecular Biology, vol 1377. Humana Press, New York, NY. https://doi.org/10.1007/978-1-4939-3179-8_14
Download citation
DOI: https://doi.org/10.1007/978-1-4939-3179-8_14
Publisher Name: Humana Press, New York, NY
Print ISBN: 978-1-4939-3178-1
Online ISBN: 978-1-4939-3179-8
eBook Packages: Springer Protocols