
Abstract
The presentation of immobilized peptides and other small biomolecules attached to surfaces can be greatly affected by the attachment chemistry and linking moieties, resulting in altered activity and specificity. For this reason, it is critical to understand how the various aspects of surface immobilization—underlying substrate properties, tether structure, and site of linkage—affect the secondary and quaternary structures of the immobilized species. Here, we present methods for attaching cysteine-containing peptides to quartz surfaces and determining the secondary structure of surface-immobilized peptides. We specifically show that, even when covalently immobilized, changes in peptide conformation can still occur, with measurement occurring in real time.
Access provided by CONRICYT – Journals CONACYT. Download protocol PDF
Key words
- Circular dichroism
- CD spectroscopy
- Antimicrobial peptide
- Bioimmobilization
- Peptide structure
- Secondary structure
- Quaternary structure
1 Introduction
Peptide microarrays can be used for myriad applications, including determination of protein binding and enzymatic specificities [1, 2], epitope mapping [3, 4], seromarker discovery [5, 6], biosensing [7–9], and development of diagnostic tools and therapeutics [4]. Most are produced either by in situ synthesis or, more commonly, by spotting onto pre-activated surfaces. Although attachment chemistry can be varied when using bead-based arrays, use of planar surfaces for production of peptide microarrays typically requires that all peptides are immobilized on the surface using the same chemistry. Use of such “universal” attachment chemistry for peptides differing in structure and function may result in suboptimal (or nonnative) presentation of the immobilized species. Indeed, we and others have found that presentation of immobilized peptides and other small biomolecules can be greatly affected by the attachment chemistry and linking moieties, resulting in altered binding affinity and specificity [10–15]. For this reason, it is critical to understand how the various aspects of surface immobilization—underlying substrate properties, tether structure, and site of linkage, to name a few—affect the secondary and quaternary structures of the immobilized species. Once these effects are known, we can begin to predict, design, and engineer new biomaterials with novel, unique, and desirable properties.
Circular dichroism (CD ) is a powerful tool for determining secondary structure of proteins and peptides in solution. Differential absorption of the right- and left-handed circularly polarized components of plane-polarized light by a protein or peptide gives rise to elliptical polarization. This dichroism can be measured as a function of wavelength (CD spectrum), with the various resulting spectral bands assigned to distinct structural features of the molecule measured (for excellent reviews, see [16, 17]). To apply this technology to surface-immobilized species, micro- and nanoparticles have been used as substrates [18–20] to increase the effective peptide or protein concentration and achieve sufficient light absorption and CD signals. The same approach can be used by stacking silica substrates onto which peptides or proteins have been immobilized [21–24].
CD has an important role in measuring the structural determinants of proteins and peptides. However, the real power of CD is in its ability to analyze secondary structural changes upon perturbation or to compare the structures of engineered peptides/proteins to their native counterparts, from which interesting peptide/protein candidates can be selected for more detailed analysis or testing. As part of ongoing research on using antimicrobial peptides (AMPs) for broad-based screening of bacterial, fungal, and viral targets [7, 9, 25], we wish to obtain structural information on immobilized AMPs to help determine the best options for semi-selective capture and detection.
Here, we first describe the methods and materials for covalent immobilization of a model α-helical cationic AMP, cecropin A, to silica slides. The silica substrates are first silanized, then activated with a heterobifunctional cross-linker, and finally incubated with cecropin A peptide for covalent linkage (Fig. 1). To achieve oriented, site-specific immobilization, a unique cysteine was appended to the C-terminus of the cecropin A peptide. We then describe structural characterization of the immobilized AMPs and demonstrate the ability of this surface-tethered AMP to undergo conformational changes in response to its interaction with a detergent mimic of its natural membrane targets. Although the immobilization techniques described here are used for CD analysis of a single immobilized peptide, the attachment methods are amenable to any thiol-containing peptide, protein, or other biomolecule arrayed on a surface by various methods [26–29].

Schematic showing site-directed attachment of cysteine-modified peptide covalently immobilized to maleimide-functionalized quartz slides
2 Materials
2.1 Peptide Immobilization
-
1.
Quartz slides: Bare quartz slides (30 mm × 9.5 mm × 0.63 mm) were custom designed from Chemglass Life Sciences (Vineland, NJ, USA) to fit in standard, open-top quartz or disposable cuvettes.
-
2.
Racks for quartz slides: Alumina cover glass staining racks from Thomas Scientific (Swedesboro, NJ, USA; catalog no. 8542E40) (see Note 1 ). The alumina rack is in the form of a 90° V-trough with an 8 mm open slot at the bottom. The sides have 12 equispaced grooves for supporting the quartz slides.
-
3.
Staining dish or beakers (for cleaning, silanization, cross-linker addition).
-
4.
Spacers: U-shaped polyetheretherketone (PEEK) spacers with the following dimensions (Fig. 2): 30 mm (height), 9.5 mm (base width), 2 mm (arm width), and 0.1 (thickness).
Fig. 2 
Diagram of the slide-spacer assembly for attachment of peptide and subsequent CD analysis. Stacks of four slides separated by three U-shaped PEEK spacers (0.1 mm thick; dimensions shown), with one spacer on each side, are assembled in a 0.5 cm cuvette. A standard disposable cuvette can be used for peptide immobilization, while a quartz cuvette is required for CD analysis (modified from [21])
-
5.
Chamber for peptide immobilization: Standard disposable 1.5 mL capacity cuvettes are used as incubation chambers for the slide/spacer assemblies during peptide deposition (see Note 2 ).
-
6.
Piranha cleaning solution: Add seven parts concentrated H2SO4 to three parts H2O2 (see Note 3 ).
-
7.
RCA cleaning solutionFootnote 1: Add one part H2O2 and one part NH4OH to five parts ultrapure water (see Note 3 ).
-
8.
Amino silane solution: Mix 2 mL (3-aminopropyl)triethoxysilane with 98 mL anhydrous toluene. Prepare this solution immediately before use within a glove bag (see Notes 4 and 5 ).
-
9.
Toluene (see Note 5 ).
-
10.
Cross-linker solution: Dissolve 25 mg N-(γ-maleimidobutyryloxy) succinimide ester (GMBS; Pierce, Rockland, IL) in 0.25 mL anhydrous dimethyl sulfoxide (DMSO). Add the GMBS/DMSO to 86 mL 100 mM phosphate buffer (PB), pH 7.5. Prepare this solution immediately before use (see Note 6 ).
-
11.
Phosphate-buffered saline (PBS), pH 7.3.
-
12.
Peptides: Peptide cecropin A was custom synthesized with a terminal cysteine (cecA-C38: KWKLFKKIEKVGQNIRDGIIKAGPAVAVVGQATQIAKC) and purified to 90 % purity by Biosynthesis, Inc. (Lewisville, TX, USA). Lyophilized cecA-C38 was dissolved in ultrapure water to 1 mg/mL (see Note 7 ). Before use, cecA-C38 is treated with tris(2-carboxyethyl)phosphine) (TCEP, 5 μM final concentration) for 30 min at room temperature prior to use (see Note 8 ).

2.2 Structural Determination
-
1.
Quartz slides with immobilized peptides: from Subheading 3.1.4.
-
2.
Peptide solutions: CecA-C38 or its base peptide cecropin A (cecA: KWKLFKKIEKVGQNIRDGIIKAGPAVAVVGQATQIAK; Biosynthesis, Inc., Lewisville, TX, USA) dissolved to 1 mg/mL in ultrapure water.
-
3.
Spacers: U-shaped polyetheretherketone (PEEK) spacers (see Note 9 ).
-
4.
Quartz spectrophotometer cell (0.5 cm) from Starna Cells, Inc. (Atascadero, CA, USA). Cuvettes for CD measurements should be clean and dry. For standard measurements, a 0.5 cm cuvette supports stacks of four individual quartz slides and five PEEK spacers.
-
5.
Ultrapure deionized water (see Note 10 ).
-
6.
1 M sodium dodecyl sulfate (SDS): Dissolve 28.84 g SDS in 80 mL of ultrapure water by stirring. Add water to a final volume of 100 mL. Store at room temperature.
-
7.
Instrumentation: All measurements were carried out on a Jasco J-815 CD spectropolarimeter (Eaton, MD, USA). Spectra were recorded at 20 °C in quartz cuvettes of 5 mm path length over the wavelength range of 190–250 nm. CD spectra were acquired at a scan speed of 20 nm/min, and results were obtained by averaging three scans.
3 Methods
3.1 Immobilization of Peptides onto Quartz Slide Surfaces
The chemoselective attachment of cysteine-modified antimicrobial peptides onto quartz slides is illustrated in Fig. 1. The overall process entails four basic steps: (1) cleaning of the surface; (2) functionalization of the surface with an amine-terminated silane; (3) addition of a heterobifunctional cross-linker, resulting in a maleimide-decorated surface; and (4) addition and covalent linking of a cysteine-containing peptide.
3.1.1 Cleaning Slides
Any contaminants present on slide surfaces will interfere with uniform functionalization of the slides and will also interfere with optical measurements. For this reason, the slides are subjected to an initial acidic piranha cleaning step, followed by a subsequent alkali-based cleaning step (RCA clean).
-
1.
Rinse each slide under a stream of distilled water, rubbing both sides to remove particulates.
-
2.
Dry each slide under an air stream.
-
3.
Place the slides in the alumina rack within a glass beaker or staining dish. Move all to a chemical hood.
-
4.
Cover the slides and rack with piranha solution and incubate for 30 min (see Note 3 ).
-
5.
Carefully remove the slides and rack (they can be held temporarily in a clean, dry beaker).
-
6.
Dispose of used piranha solution within the staining dish as hazardous waste according to government and institutional regulations (see Note 11 ).
-
7.
Place slides and rack back into staining dish and move to a shielded sink.
-
8.
Fill the staining dish containing the slides to overflowing with copious amounts of deionized water to effectively dilute the remaining cleaning solution before removing and rinsing the slides. Rinse exhaustively with deionized water.
-
9.
Using forceps to handle the slides, rinse each slide individually with deionized water and follow by drying with flowing nitrogen gas or air.
-
10.
Place slides into a clean, dry alumina rack. Place rack within a new, clean glass beaker or staining dish and move to a chemical hood.
-
11.
Cover the slides and rack with RCA cleaning solution and incubate for 30 min (see Note 3 ).
-
12.
Carefully remove the slides and rack (they can be held temporarily in a clean, dry beaker).
-
13.
Dispose of used RCA cleaning solution within the staining dish as hazardous waste according to government and institutional regulations (see Note 11 ).
-
14.
Place slides and rack back into staining dish and move to a shielded sink.
-
15.
Fill the staining dish containing the slides to overflowing with copious amounts of deionized water to effectively dilute the remaining cleaning solution before removing and rinsing the slides. Rinse exhaustively with deionized water.
-
16.
Using forceps to handle the slides, rinse each slide individually with deionized water and follow by drying with flowing nitrogen gas or air.
-
17.
Place slides into a clean, dry alumina rack within a clean glass beaker with cover.
3.1.2 Silanization
Treatment of the cleaned slides with an amine silane provides a reproducible, uniform surface functionalized with pendant amines to which a cross-linker can be attached.
-
1.
Transfer the beaker containing the slides and rack to a nitrogen-filled glove bag within a chemical fume hood.
-
2.
Within the glove bag, prepare the amino silane solution and immediately pour over the quartz slides. Cover the beaker to minimize evaporation and incubate for 30 min within the glove bag (see Notes 4 and 5 ).
-
3.
Remove the beaker from the glove bag.
-
4.
Using forceps to handle the slides, rinse each slide in toluene three times by swishing the slide three to five times sequentially in three 100 mL beakers filled with fresh toluene.
-
5.
Dry each slide with flowing nitrogen gas or air. Ensure no solvent remains on the sides of each slide.
-
6.
Return silanized quartz slides to a clean, dry alumina rack. Silanized slides may be kept dried under nitrogen for up to 1 week.
3.1.3 Attachment of Cross-Linker
The heterobifunctional cross-linker used here, GMBS, has an N-hydroxysuccinimidyl terminus for attachment to pendant amines on the silanized surface. In subsequent steps, the maleimide terminus will be used to attach cysteine-containing peptides, via their unique thiol moiety (see Note 12 ).
-
1.
Place silanized slides (within a clean alumina rack, from Subheading 3.1.2) into a clean glass beaker.
-
2.
Pour freshly prepared cross-linker solution over the rack and slides (see Note 6 ). Place a lid on the glass beaker and incubate for 30 min at room temperature.
-
3.
Using forceps to handle the slides, rinse each slide three times by swishing the slide three to five times sequentially in three 100 mL beakers filled with deionized water.
-
4.
Immediately after rinsing, dry each slide with a flowing nitrogen gas or air.
-
5.
Proceed immediately to peptide immobilization (Subheading 3.1.4).
3.1.4 Chemoselective Immobilization of Cysteine-Modified Antimicrobial Peptides
Peptides containing a unique cysteine are incubated with the functionalized slide surface; pendant maleimides from the surface-attached GMBS cross-linker covalently link to the cysteine’s thiol moiety. To process multiple slides simultaneously, slides are assembled into a stack, with spaces placed between the slides and at the top and bottom of the stack. The assembled stack is then loaded into a standard disposable cuvette for incubation with peptide (see Note 2 ).
-
1.
Assemble four GMBS-treated slides, separated by PEEK spacers, in a standard 1.5 mL capacity disposable cuvette. A slide-spacer assembly comprised of four slides and five spacers is required for the analysis of each peptide (see Fig. 2).
-
2.
Fill the cuvette chamber with 100 μg/mL cysteine-modified peptide (e.g., cecA-C38) in 10 mM phosphate buffer, pH 6.0; for the 1.5 mL capacity, 1 mL of peptide solution is required to cover the entire slide-spacer assembly.
-
3.
Cover with parafilm to minimize evaporation and incubate overnight at 4 °C.
-
4.
After overnight incubation at 4 °C, remove each slide from the stack using forceps and rinse by swishing the slide three to five times sequentially in three 100 mL beakers filled with deionized water to remove reversibly bound peptides.
-
5.
Coated slides are stored in a small beaker or cuvette filled with water (see Note 13 ).
-
6.
The peptide-coated slides and spacers are then reassembled and transferred into a clean 0.5 cm quartz cuvette filled with 1 mL ultrapure water, ready for CD analysis (see Note 14 ).
3.2 Circular Dichroism Measurements
Circular dichroism measurements are obtained for both solution-phase peptides and peptide immobilized onto slides. In each case, SDS is added to the cuvettes (solution-phase peptide, immobilized peptide) to mimic the peptide’s natural membrane target. In solution, upon addition of SDS, the peptide should undergo a change in secondary structure from a disordered, random orientation to a conformation with high helical content [30, 31].
3.2.1 CD Spectrum Measurement of Peptides in Solution
The solution-phase measurements are performed with the cysteine-modified and native peptides to ensure that incorporation of the cysteine does not affect its native structure and ability to undergo conformational changes. These data should be collected two to three times to ensure the sample has reached equilibrium. Once it has been determined that the signal is not changing over time, data can be averaged and blanks (no peptide) subtracted out (see Note 15 ).
-
1.
Settings for the Jasco J-815 circular dichroism spectrometer are as follows: wavelength scan from 190 to 250 nm in a thermally controlled (20 °C) quartz cell having a 0.5 cm path length. The data were gathered with data pitch of 1 nm, D.I.T. of 8 s, bandwidth of 1 nm, and a scan speed of 50 nm/min.
-
2.
Determine the spectrum of the blank. Fill the cell with 1 mL water and determine the CD and absorbance spectra. Collect data three times and average the data.
-
3.
Rinse cell with ultrapure deionized water.
-
4.
Replace water with 1 mL of peptide solution (>30 μg/mL) and collect the CD and absorbance spectra.
-
5.
Collect data three times for a total of three replicates with each peptide concentration (±SDS). Average the data.
-
6.
Repeat steps 3–5 for the next peptide sample.
3.2.2 CD Spectrum Measurement of Slide-Immobilized Peptides
Determining percentages of various secondary structures generally requires knowing the exact protein concentrations and path length of the cuvette. When analyzing surface-immobilized peptides, measurement of concentration is impractical and often unreliable. However, if the same sample and cell are used for both CD and absorbance measurements, concentration and path length determinations are not necessary (see Note 16 ).
-
1.
Settings for the Jasco J-815 circular dichroism spectrometer are as follows: wavelength scan from 190 to 250 nm in a thermally controlled (20 °C) quartz cell having a 0.5 cm path length. The data were gathered with data pitch of 1 nm, D.I.T. of 8 s, bandwidth of 1 nm, and a scan speed of 50 nm/min.
-
7.
Determine the spectrum of the blank. Fill the cell with 1 mL water. Assemble the slides that have been treated with only silane and cross-linker (no peptides) with the PEEK spacers in the cell. Be careful to avoid the formation of air bubbles. Determine the CD and absorbance spectra. Collect data three times and average the data.
-
2.
Remove the slide-spacer assembly and store in ultrapure deionized water.
-
3.
Determine the spectrum of the blank in the presence of SDS. Rinse the cell with ultrapure deionized water. Fill the cell with 1 mL of SDS solution (20 mM). Reassemble the blank slide-spacer stack in the SDS solution and collect the CD and absorbance spectra. Collect data three times and average the data.
-
4.
Rinse cell with ultrapure deionized water.
-
5.
Fill the cell with 1 mL ultrapure deionized water. Assemble peptide-immobilized slides with PEEK spacers, and collect the CD and absorbance spectra. Collect data three times and average the data.
-
6.
Remove the slide-spacer assembly and store in ultrapure deionized water.
-
7.
Replace water with 1 mL of SDS solution (20 mM) and reassemble the peptide-treated slide-spacer stack in the SDS solution and collect the CD and absorbance spectra. Collect data three times and average the data.
-
8.
Repeat steps 4–6 for the next set of peptide-immobilized slides.
3.3 Data Analysis
The raw spectrophotometric data can be used to extract information about secondary and quaternary structures through data deconvolution. Appropriate controls and replicates are therefore absolute requirements for meaningful interpretation of structural data.
While the spectra themselves can be used to determine secondary structures, the ratios of mean residue molar ellipticities (for peptides in solution) or g-factor values (for immobilized peptides) at 222 and 208 nm can be used as an indication of the presence of coiled coils or other quaternary assemblies of helical peptides. A 222 nm/208 nm ratio higher than 1.0 is generally indicative of a coiled coil formation; ratios of less than 0.9 generally indicate the presence of isolated, monomeric helices.
3.3.1 Peptides in Solution
When comparing the CD spectra of different solution peptide constructs, or the same construct at different concentrations, it is important to normalize the instrument units of millidegree ellipticity by conversion to mean residue molar ellipticity, Θ, using the following equation:
where n is the number of peptide bonds and ellipticity is the raw data from the instrument.
-
1.
Subtract baseline from the spectrum of the sample. The ellipticity for most peptides should be close to zero at 250 nm.
-
2.
Convert the data to mean residue ellipticity using Eq. 1. See Fig. 3 for an example.
Fig. 3 
CD spectra of native cecropin A and C-terminally modified cecropin A. Even without surface immobilization, it is important to determine if the incorporation of a thiol group on the C-terminus affects the α-helical folding behavior of cecA. For this reason, we investigated—in solution—the SDS-induced, secondary structure transition of cysteine-modified cecA (cecA C38) compared to the wild-type peptide (cecA WT). The presence of a cysteine at the C-terminus did not change the native structure in water or the transition from unstructured to α-helix in the presence of SDS
-
3.
Analyze the data using the CDPro package or equivalent online software (DichroWeb) to evaluate secondary structural content (α-helix, β-strand, turns, etc.) using data collected between 190 and 240 nm.
-
4.
Calculate 222 nm/208 nm ratios for each spectrum.
-
5.
Calculate the mean and 95 % confidence interval (CI) for all of the sets of experimental data collected. Perform appropriate statistical analysis (e.g., Student’s unpaired t test) to determine whether differences in content are statistically significant.

3.3.2 Immobilized Peptides
Both the shape of the CD spectrum (peak positions) and its absolute magnitude influence calculations of structural content (e.g., α-helices, parallel and antiparallel β-sheet, turns, and “other” structures). Although obtaining accurate concentrations of immobilized peptides and proteins can be difficult, reliable structural content calculations can be performed without knowing the exact concentrations of immobilized peptide by g-factor analysis [32]. The dimensionless g-factor is independent of path length, concentration, amino acid content, and molecular weight and is calculated when the same sample and cell are used for both CD and absorption measurements. Secondary structure can then be deduced from the g-factor spectra of samples with known structure. A g-factor spectrum is calculated by dividing the differential absorbance of left- and right-handed circularly polarized light (A l and A r, respectively) by the absorbance at each wavelength (A):
Once the g-factor spectrum is determined, the data are deconvoluted using CDPro software to obtain a quantitative assessment of the secondary structural content of the peptide. Information on quaternary structure (inter-peptide interactions) can be extracted from the 222 nm/208 nm ratio. The 222 nm/208 nm ratio ≥1.0 is indicative of coiled coils, while ≤0.9 is indicative of α-helix monomers [33].
-
1.
Subtract slide-spacer baseline from the spectrum of the sample. The ellipticity for most peptides should be close to zero at 250 nm.
-
2.
Calculate g-factor spectra based on Eq. 2 for the peptide-treated samples. See Fig. 4 (left panel) for an example.
Fig. 4 
Representative g-factor spectra of surface-immobilized cecropin A in the presence or absence of SDS (20 mM) and calculated structural contents. Upon addition of SDS (left panel), there is an apparent change in conformation of the immobilized peptide. The table shown (right) indicates the relative percentages of various secondary structural motifs ± SDS, based on spectral data deconvoluted using CDPro. Although the SDS-induced change in α-helical content is small, this change is statistically significant (p < 0.05)
-
3.
Analyze the data using the CDPro package or equivalent online software (DichroWeb) to evaluate secondary structural content (α-helix, β-strand, turns, etc.) using data collected between 190 and 240 nm (see Fig. 4, right panel).
-
4.
The ratio of 222 nm/208 nm is calculated by dividing the observed g-factor value at 222 nm by the observed g-factor value at 208 nm for each spectrum and is used to discern quaternary structure (see Fig. 5).
Fig. 5 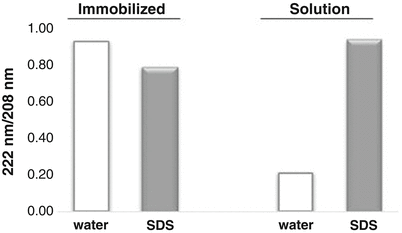
The ratio of 222 nm/208 nm can be used to assess quaternary structure. A ratio of 222 nm/208 nm greater than 1.0 is indicative of fully folded coiled coils. A ratio of 222 nm/208 nm less than 0.9 is indicative of fully folded single-stranded α-helices. In solution, CecA C38 exhibits a 222 nm/208 nm ratio of 0.2 in water (random coil), which increases to 0.9 in the presence of SDS, indicative of monomeric α-helices. In contrast, when immobilized to the surface, cecA C38 has a 222 nm/208 nm ratio of 0.8–0.9, suggesting the fully helical yet single-stranded state both in the presence or absence of SDS
-
5.
Calculate the mean and 95 % confidence interval (CI) for all sets of experimental data collected. Perform appropriate statistical analysis (e.g., Student’s unpaired t test) to determine whether differences in content are statistically significant.


4 Notes
-
1.
Metal and plastic racks may be incompatible with the solutions for cleaning and silanization of the quartz slides.
-
2.
As peptides and proteins are expensive, we use standard disposable spectrophotometer cuvettes as incubation chambers during peptide addition to decrease the volume of peptide solution needed. If using less expensive biologicals, a staining dish or beaker may be used instead. Use of slide/spacer assemblies allows multiple slides to be modified on both sides at the same time.
-
3.
All work with the piranha solution and RCA cleaning solution should be performed in a chemical hood by personnel wearing appropriate personal protective equipment (lab coat, gloves, and face shield) who have been trained in the use and handling of oxidizers. Due to the self-decomposition of hydrogen peroxide, piranha solution should be used freshly prepared. In piranha, H2O2 reacts with H2SO4 exothermically and will start to bubble and heat up. Piranha solution can be explosive near or in contact with acetone, propanol, or any organic solvents. Also, explosions may occur if the peroxide solution concentration is more than 50 %. Used piranha solutions must be allowed to cool and off-gas in an open container left inside of a chemical fume hood for 24 h after use. After the initial 24 h has passed, the cooled piranha solution may be transferred to a piranha waste bottle—glass bottle with a vented cap.
-
4.
Silane is sensitive to humidity. To avoid hydrolysis and subsequent cross-linking, open the silane bottle and perform all subsequent steps in an inert atmosphere, such as a nitrogen-filled glove bag.
-
5.
Both silane and toluene are hazardous to human health; toluene is a reproductive hazard and hepatotoxin. All manipulations of solutions containing toluene should be performed in a chemical hood by personnel equipped with appropriate personal protective equipment.
-
6.
The GMBS cross-linker targets both amines and sulfhydryls. The amine-targeting moiety of the cross-linker, N-hydroxysuccinimidyl ester, hydrolyzes rapidly in aqueous buffers, especially at basic pHs. To avoid unnecessary hydrolysis, store the cross-linker in a dessicator at 4 °C and warm to room temperature before opening both the dessicator and vial. Prepare solutions immediately before use and avoid using any amine-containing buffer, such as Tris.
-
7.
Lyophilized peptides may contain a significant % bound water and salts by weight. Therefore, it is critical to determine peptide concentration prior to use. Protein concentrations may be verified by UV spectrophotometry at 280 nm or by a bicinchoninic acid (BCA) assay (Pierce, Rockford, IL, USA).
-
8.
TCEP is a reducing agent that is added to prevent disulfide bond formation among individual peptide molecules. Reduction of existing disulfides ensures that a pendant thiol moiety is available for covalent immobilization to the maleimide groups displayed on the slide surface.
-
9.
Circular dichroism analysis on a planar surface is limited by the low surface area of the substrates and the finite surface coverage of the immobilized peptides. To overcome these limitations, the quartz slides are stacked, separated by 0.1 mm thick polyetheretherketone (PEEK) spacers, to increase the effective peptide concentration in the optical path [34, 35].
-
10.
Solutions for CD spectroscopy should not contain any materials that are optically active and should be as transparent as possible. Peptides dissolved in water alone have the highest transparency. However, many samples denature in the absence of salt. Buffers with low concentrations of salts and are amenable for use in CD analysis include 10 mM potassium phosphate, 100 mM KCl; 10 mM potassium phosphate, 100 mM NaCl; Dulbecco’s phosphate-buffered saline; and 2 mM HEPES, 50 mM NaCl, 2 mM EDTA, and 1 mM dithiothreitol. It is important to note that different buffers will demonstrate different lower wavelength limits, below which the signal to noise is poor and the ellipticity is no longer a linear function of the path length of the cell [16].
-
11.
The beaker/dish used for temporary storage of piranha- or RCA-cleaned slides should also be rinsed with copious amounts of water.
-
12.
Although we have found that GMBS provides the optimal length and tether characteristics for immobilizing our peptides of interest, other linkers with similar amine- and thiol-targeting termini can be used. Care should be exercised when using other linkers, as we have observed that some linkers may interact directly with peptide domains not involved in chemical linking. For example, the long-chain hydrophobic linker, KMUS (Pierce), causes misfolding of hydrophobic peptides in solution.
-
13.
Although we typically use our coated slides on the day of preparation, they can be used within 2 days with no decrease in performance.
-
14.
A slide-spacer assembly without any immobilized peptide serves as a blank for background spectra. This control should be measured before any peptide-functionalized slides are measured.
-
15.
Although many CD instruments can normalize for background values, we prefer to do this post-analysis data processing to maintain statistical relevance.
-
16.
The Jasco CD spectrometer is capable of measuring both absorbance and CD spectra simultaneously. Measurements on other instruments incapable of simultaneous measurements will need to be performed in sequence.
Notes
- 1.
The RCA cleaning technique was developed during the 1960s by Werner Kern at RCA Laboratories (hence, the moniker of this solution) and has become a gold standard method for removing surface impurities from silicon semiconductors and glass substrates.
References
Gosalia DN, Salisbury CM, Maly DJ et al (2005) Profiling serine protease substrate specificity with solution phase fluorogenic peptide microarrays. Proteomics 5:1292–1298
Thiele A, Zerweck J, Schutkoweki M (2009) Peptide arrays for enzyme profiling. Methods Mol Biol 570:19–65
Buus S, Rockberg J, Forsström B et al (2012) High-resolution mapping of linear antibody epitopes using ultrahigh-density peptide microarrays. Mol Cell Proteomics 11:1790–1800
Price JV, Tangsombatvisit S, Xu G et al (2012) On silico peptide microarrays for high-resolution mapping of antibody epitopes and diverse protein-protein interactions. Nat Med 18:1434–1440
Carmona SJ, Sanrtor PA, Leguizamon MS et al (2012) Diagnostic peptide discovery: prioritization of pathogen diagnostic markers using multiple features. PLoS One 7, e50748
Cooley G, Etheridge RD, Boehlke C et al (2008) High throughput selection of effective serodiagnostics for Trypanosoma cruzi infection. PLoS Negl Trop Dis 2, e316
Kulagina N, Taitt C, Anderson GP et al (2014) Affinity-based detection of biological targets. US Patent no. 8,945,856 B2 (issued 3 Feb 2015)
Kulagina NV, Lassman ME, Ligler FS et al (2005) Antimicrobial peptides for detection of bacteria in biosensor assays. Anal Chem 77:6504–6508
Taitt CR, North SH, Kulagina NV (2009) Antimicrobial peptide arrays for detection of inactivated biothreat agents. Methods Mol Biol 570:233–255
Han X, Liu Y, Wu F-G et al (2014) Different interfacial behaviors of peptides chemically immobilized on surfaces with different linker lengths and via different termini. J Phys Chem B 118:2904–2912
Han X, Uzarski JR, Mello CM et al (2013) Different interfacial behaviors of N- and C-terminus cysteine-modified cecropin P1 chemically immobilized onto polymer surface. Langmuir 29:11705–11712
Ngundi MM, Taitt CR, Ligler FS (2007) Crosslinkers modify affinity of immobilized carbohydrates for cholera toxin. Sens Lett 5:621–624
North S, Lock E, Walton S et al (2014) Processing microtitre plates for covalent immobilization chemistries. US Patent no. 8,651,158 B2 (issued 18 Feb 2014)
North S, Wojciechowski J, Chu V et al (2012) Surface immobilization chemistry influences peptide-based detection of lipopolysaccharide and lipoteichoic acid. J Pept Sci 18:366–372
Shriver-Lake LC, North SH, Dean SN et al (2013) Antimicrobial peptides for detection and diagnostic assays. In: Piletsky SA, Whitcomb MJ (eds) Designing receptors for the next generation of biosensors. Springer, Heidelberg, pp 85–104
Greenfield NJ (2007) Using circular dichroism spectra to estimate protein secondary structure. Nat Protoc 1:2876–2890
Kelly SM, Jess TJ, Price NC (2005) How to study proteins by circular dichroism. Biochim Biophys Acta 1751:119–139
Nygren P, Lundqvist M, Broo K et al (2008) Fundamental design principles that guide induction of helix upon formation of stable peptide − nanoparticle complexes. Nano Lett 8:1844–1852
Read MJ, Burkett SL (2003) Asymmetric α-helicity loss within a peptide adsorbed onto charged colloidal substrates. J Colloid Interface Sci 261:255–263
Stevens MM, Flynnn NT, Wang C et al (2004) Coiled-coil peptide-based assembly of gold nanoparticles. Adv Mater 16:915–918
Fears KP, Petrovykh DY, Photiadis SJ et al (2013) Circular dichroism analysis of cyclic β-helical peptides adsorbed on planar fused quartz. Langmuir 29.32 (2013): 10095–10101.
Gallardo IF, Webb LJ (2012) Demonstration of α-helical structure of peptides tethered to gold surfaces using surface infrared and circular dichroic spectroscopies. Langmuir 28:3510–3515
Sivaraman B, Fears KP, Latour RA (2009) Investigation of the effects of surface chemistry and solution concentration on the conformation of adsorbed proteins using an improved circular dichroism method. Langmuir 25:3050–3056
Vermeer AWP, Norde W (2000) CD spectroscopy of proteins adsorbed at flat hydrophilic quartz and hydrophobic Teflon surfaces. J Colloid Interface Sci 225:394–397
Kulagina NV, Shaffer KM, Anderson GP et al (2006) Antimicrobial peptide-based array for Escherichia coli and Salmonella screening. Anal Chim Acta 575:9–15
Fu J, Reinhold J, Woodbury NW (2011) Peptide-modified surfaces for enzyme immobilization. PLoS One 6, e18692
Lesaicherre M-L, Uttamchandani M, Chen GYJ et al (2002) Developing site-specific immobilization strategies of peptides in a microarray. Bioorg Med Chem Lett 12:2079–2083
Ngundi MM, Taitt CR, Ligler FS (2006) Simultaneous determination of kinetic parameters for the binding of cholera toxin to immobilized sialic acid and monoclonal antibody using an array biosensor. Biosens Bioelectron 22:124–130
Ngundi MM, Taitt CR, McMurry SA et al (2006) Detection of bacterial toxins with monosaccharide arrays. Biosens Bioelectron 21:1195–1201
Silvestro L, Axelsen PH (2000) Membrane-induced folding of cecropin A. Biophys J 79:1465–1477
Lee E, Jeong K-W, Lee J et al (2013) Structure-activity relationships of cecropin-like peptides and their interactions with phospholipid membrane. BMB Rep 46:282–287
McPhie P (2001) Circular dichroism studies on proteins in films and in solution: estimation of secondary structure by g-factor analysis. Anal Biochem 293:109–119
Becktel WJ, Schellman JA (1987) Protein stability curves. Biopolymers 26:1859–1877
Blondelle SE, Ostresh JM, Houghten RA et al (1995) Induced conformational states of amphipathic peptides in aqueous/lipid environments. Biophys J 68:351–359
Fears KP, Latour R (2009) Assessing the influence of adsorbed-state conformation on the bioactivity of adsorbed enzyme layers. Langmuir 25:13926–13933
Acknowledgments
This work was supported through the Office of Naval Research and the Naval Research Laboratory Core research programs. The views expressed herein are those of the authors and do not represent those of the US Naval Research Laboratory, the US Navy, the US Department of Defense, or the US Government.
Author information
Authors and Affiliations
Corresponding author
Editor information
Editors and Affiliations
Rights and permissions
Copyright information
© 2016 Springer Science+Business Media New York
About this protocol
Cite this protocol
North, S.H., Taitt, C.R. (2016). Secondary Structure Determination of Peptides and Proteins After Immobilization. In: Cretich, M., Chiari, M. (eds) Peptide Microarrays. Methods in Molecular Biology, vol 1352. Humana Press, New York, NY. https://doi.org/10.1007/978-1-4939-3037-1_4
Download citation
DOI: https://doi.org/10.1007/978-1-4939-3037-1_4
Publisher Name: Humana Press, New York, NY
Print ISBN: 978-1-4939-3036-4
Online ISBN: 978-1-4939-3037-1
eBook Packages: Springer Protocols