
Abstract
The possibility to generate cardiomyocytes (CMs) from disease-specific induced pluripotent stem cells (iPSCs) is a powerful tool for the investigation of various cardiac diseases in vitro. The pathological course of various cardiac conditions, causatively heterogeneous, often converges into disturbed cellular Ca2+ cycling. The gigantic Ca2+ channel of the intracellular Ca2+ store of CMs, the ryanodine receptor type 2 (RyR2), controls Ca2+ release and therefore plays a crucial role in Ca2+ cycling of CMs. In the present protocol we describe ways to measure and analyze global as well as local cellular Ca2+ release events in CMs derived from a patient carrying a CPVT-causing RyR2 mutation.
Access provided by CONRICYT – Journals CONACYT. Download protocol PDF
Keywords:
1 Introduction
Cardiovascular diseases (CVDs) are the most frequent cause of death in developed countries and their prevalence is expected to increase in future as population ages [1]. Approximately 43 % of CVDs are the consequence of ischemic cardiomyopathy and the resulting heart failure. However, in a smaller subset of mostly younger patients CVDs are caused by specific mutations in genes encoding cardiac ion channel subunits, cardiac structural proteins or their regulatory factors leading to various channelopathies (e.g., short QT syndrome, long QT syndrome, Brugada syndrome, catecholaminergic polymorphic ventricular tachycardia) and cardiomyopathies (e.g., dilated cardiomyopathy, hypertrophic cardiomyopathy, arrhythmogenic right ventricular cardiomyopathy). Exploring pathophysiological mechanisms underlying these diseases and developing more effective therapeutic approaches has been hampered by lack of suitable human in vitro assay systems and shortcomings of existing cell-based and animal disease models [2–5]. CMs derived from disease-specific induced pluripotent stem cells (iPSCs) represent a novel in vitro cellular model of human inherited heart diseases with an unprecedented potential for generating new mechanistic insight into disease pathophysiology and improving the process of drug development. The unique feature of this model is that it enables an unlimited supply of required disease-specific cell types and that the cell autonomous aspects of the disease and drug effects (therapeutic and toxic) can be studied on the genetic background of the affected patient [6]. However, the most important prerequisite for successful use of iPSC-derived CMs (iPS-CMs) for disease modelling, drug discovery, or regenerative medicine is that their functional and structural properties resemble those of adult CMs.
One of the essential features of CM physiology is their ability to rapidly increase cytosolic Ca2+ concentration in response to spontaneous or induced membrane depolarizations. In this process, small amounts of Ca2+ that enter into the cell through voltage-gated L-type Ca2+ channels (ICa) bind to ryanodine receptor type 2 (RyR2) in the membrane of the sarcoplasmic reticulum (SR) and in turn induce massive release of Ca2+ into the cytosol from intracellular Ca2+ stores in the SR. Sporadic subcellularly localized calcium releases can be observed in CMs during diastole as spatiotemporally restricted Ca2+ sparks [7]. They originate from a single RyR2 or a cluster of RYR2s and represent the elementary events of cardiac excitation–contraction (E-C) coupling. The recruitment and summation of many Ca2+ sparks in the beginning of systole produces global whole-cell Ca2+ transients. At this point of time the cytosolic Ca2+ concentration rises transiently approximately tenfold and activates Ca2+-sensitive contractile protein troponin C. This is followed by induction of cross-bridge cycles at the molecular level, sarcomere shortening at the subcellular level and heart muscle contraction at the organ level. This process is terminated by removal of Ca2+ from the cytosol either out of the cell by the sodium–calcium exchanger (NCX) and plasma membrane calcium ATPase or back into the SR by the calcium ATPase located in the SR membrane (SERCA2a). Calcium homeostasis in CMs is perturbed in a number of acquired and inherited heart diseases, such as cardiac hypertrophy, heart failure, CPVT, and ARVC [8, 9]. Hence, analysis of calcium handling in CMs is an essential part in characterisation of their functional properties and identification of potential pathological features.
Analyses of Ca2+-signalling parameters in cultured iPS-CMs demonstrated that ICa-gated SR Ca2+-release is the primary mechanism for the release of Ca2+ when the cell is depolarized by the action potential [10]. Relaxation, in a manner similar to mammalian myocardium, was mediated by reuptake of Ca2+ into the SR and extrusion of Ca2+ by the NCX. Sporadic and brief Ca2+-sparks and focal releases with spatiotemporal properties analogous to that of adult CM were also observed in human iPS-CMs [10, 11]. However, sparks were stochastic with a tendency of repetitive occurrence at the same site that may reflect an immature status of the human iPS-CMs [11]. However, more mature Ca2+ handling properties could be induced in human embryonic stem cell (ESC)-derived CMs and iPS-CMs by prolonged cultivation [12], seeding of iPS-CMs onto microgrooved culture substrates [13] or electrical stimulation of 3D human iPS-CM-derived tissue [14]. These findings suggest that human ES-CMs and iPS-CMs represent a reliable Ca2+-signalling model of adult CMs [15–18]. Moreover, iPSC-based in vitro models of human inherited cardiac arrhythmias and cardiomyopathies have demonstrated that disease-specific iPS-CMs are capable of reproducing the corresponding pathological calcium handling phenotype in vitro and that specific drugs ameliorate the electrical and Ca2+-signalling disturbances in diseased CMs [10, 19–22].
Analyses of Ca2+-signalling parameters in cultured CMs are traditionally based on the use of ratiometric calcium dyes such as Fluo-4 or genetically encoded calcium indicators such as GCaMP followed by the detection of spatiotemporal changes in their fluorescence intensities using epifluorescence or confocal microscopy [23, 24]. In this protocol we describe an experimental approach that can be used to investigate global and local cytosolic Ca2+ signals in healthy and diseased iPS-CMs in culture.
2 Materials
Solutions are prepared using ultrapure deionized H2O (Milli-Q or alike, ≥18 MΩ·cm) and analytical grade reagents.
2.1 Ca2+ Imaging Solutions
-
1.
HEPES-buffered, pyruvate containing Tyrode’s solution [25]: For Ca2+ imaging, cells are kept in sterile-filtered (0.2 μm) Tyrode’s solution containing (in mmol/l) NaCl 140, KCl 5.4, MgCl2 1, sodium pyruvate 2, CaCl2 1, glucose 10, HEPES 10, pH 7.4, adjusted with NaOH at room temperature (RT) (see Note 1 ).
-
2.
Fluo-4 calcium indicator (Fluo-4, AM-ester, Life Technologies): A 1 mM Fluo-4 AM stock solution in DMSO is made by adding 46 μl DMSO into a 50 μg Fluo-4 AM vial (molecular mass of Fluo-4AM: 1096.95). The 1 mM stock can be aliquoted (5 μl aliquots, for instance) and kept at −20 °C for several months (PROTECTED FROM LIGHT). A working solution of 5 μM Fluo-4 AM is made by diluting the stock solution 1:200, e.g., adding 995 μl Tyrode’s solution into the 5 μl stock solution (see Note 2 ). Prepare Fluo-4 working solutions on the day of experiment.
-
3.
Caffeine (Sigma Chemicals): To prepare a 50 mM caffeine stock solution, 1 g caffeine is dissolved in 103 ml Tyrode’s solution and is sterile filtered (0.2 μm). The stock solution is aliquoted in adequate volumes and stored at −20 °C. Working solutions are prepared freshly on the day of the experiment. A typical caffeine working concentration for emptying SR Ca2+ stores of cardiomyocytes via RyR2 activation is 10 mM. However, this may not always be sufficient (see Note 3 ).
-
4.
Ryanodine (Tocris, catalogue Nr. 1329; Molecular weight of Ryanodine: 493.55; solubility: 10 mM in ethanol, 25 mM in DMSO): 100 μl DMSO are added to the vial containing 1 mg lyophilized ryanodine, followed by vigorous vortexing. This will give a 20 mM ryanodine stock, which can be aliquoted and kept protected from light for 1–2 months at −20 °C. When used in μM to 1 mM concentration, ryanodine blocks the RyR2 Ca2+ release channels in the SR (see Note 4 ). For instance, a ≥200 μM working concentration of ryanodine will block the channels in a use dependent manner, i.e., the channel should be activated (typically by electrically pacing of CMs, if they do not beat spontaneously, as shown in Fig. 2) for several minutes. Do not use ryanodine concentrations <200 μM if you aim at a complete RyR2 channel block [26].
-
5.
Isoproterenol (Isoprenaline, ISO; Sigma; MW of Isoprenaline hydrochloride: 247.72): A 10 mM ISO stock is made by dissolving 30 mg isoprenaline hydrochloride in 12.11 ml H2O. Practically, a rough amount of ~20–30 mg isoprenaline hydrochloride is first transferred into a vial (e.g., a 15 ml sterile Falcon tube), and, according to the actual precise weight, the amount of 404 μl H2O per mg isoprenaline hydrochloride is added into the vial to receive a 10 mM stock. The ISO stock solution is filtered (0.2 μm), aliquoted and kept at RT (<25 °C) for at least a week, protected from light. ISO solutions can be slightly yellow and become pink to brownish pink with time. In this case preparation of fresh solutions is recommended. The ISO working concentration is usually 1 μM. Dilution of the 10 mM stock into the working concentration can be done in two 1:100 steps in Tyrode’s solution.
3 Methods
Cardiac differentiation of human iPSCs can be carried out by using different protocols, including the embryoid body-based method or small molecule-based directed differentiation protocol of monolayer iPSC cultures as described elsewhere [27–29] (Fig. 1). For Ca2+ imaging, microdissected beating clusters or monolayers of spontaneously beating iPS-CMs should be dissociated with collagenase B or Trypsin/EDTA at the desired day of differentiation. Single CMs are plated on 35 mm glass bottom dishes with 15 mm glass bottom diameter (P35G-1.5-14-C, MatTek, Ashland, MA) which have been coated with fibronectin (2.5 μg/ml) dissolved in phosphate buffered saline (PBS, pH 7.4) for 3 h or overnight at 37 °C in a humidified atmosphere with 5 % CO2. After plating, cells should be cultured for 36–72 h to allow attachment to fibronectin before use in Ca2+ imaging experiments.

Cross-striations in murine (a) and human (b) iPSC-derived CMs stained for a sarcomeric protein cardiac alpha-actinin. CMs derived from mouse iPS cells were prepared by methods as described previously [30]. This iPS cell line (clone AT25) was genetically modified to express puromycin resistance gene under the control of α-myosin heavy chain (α-MHC) promoter to enable purification of CMs. For the purpose of this analysis, murine iPS-CMs were analyzed on day 42 of differentiation. Purified human iPS-CMs (Cor.4U®) were kindly provided by Axiogenesis AG (http://axiogenesis.com/) and plated on fibronectin-coated plates before staining
3.1 Loading of Human iPS-CMs with the Fluo-4 Ca2+ Indicator
-
1.
Take cells from the incubator and mount the culture dish stably onto the stage of the microscope.
-
2.
Make the first microscopic overview using the transmitted light mode to ensure the presence and intactness of cells and to choose appropriate region for imaging (i.e., clear dish bottom, no debris, the appropriate cell density enabling imaging of single cells).
-
3.
Aspirate the medium and wash the cells two times with 2 ml Tyrode’s solution. Be careful not to remove too much solution during washing and make sure that cells are always covered with fluid (however, see Note 5 ).
-
4.
After the second wash step, replace the Tyrode’s solution with Tyrode’s solution containing 5 μM Fluo-4 AM and leave the cells at RT for 20–30 min (see Note 6 ). During Fluo-4 loading cells should be kept in the dark and the dish covered with a lid to reduce evaporation.
-
5.
Upon loading, wash the cells two times with Tyrode’s solution and leave them for another 20 min at RT to complete de-esterification of Fluo-4 AM within the cells. The culture dish should be covered with a lid to reduce evaporation.
3.2 Microscopic Examination and Measurements
-
1.
Upon Fluo-4 AM loading, select suitable CMs under the inverted fluorescence microscope. The criteria for cell selection are: appropriate Fluo-4 loading (see Note 7 ), cellular integrity (e.g., no blobs protruding from the cell), and spontaneous contractile activity. We typically perform this step of selection visually under the 20× oil immersion objective, under illumination with the mercury bulb, using the EGFP-filter set. Care is taken to accomplish this step rapidly and to avoid high illumination intensities.
-
2.
Following the selection, move the cell of interest to the center in the field of view and switch the objective to 40× oil or 60× oil. If necessary, bring the cell back into the focus.
-
3.
Switch off the visual inspection and record a first x-y scan under low laser intensity (0.1–1.0 % in our setup) using the 488 nm argon laser line (see Note 8 ). This first scan is an overview, allowing for selection of a region of interest (ROI) via the ROI tool of the measuring software. In most cases our ROIs are squares or rectangles, encompassing the selected cell.
-
4.
Perform a brief fine tuning of the Z-focus to reach maximum fluorescence intensity. This is done by activating the continuous, fast x-y scanning mode and moving the focus knob up and down to find the focus position with the brightest fluorescence. To increase the signal intensity we sacrifice a bit of the confocality by opening the confocal aperture (c.a.) above the value recommended by the system for a particular objective (see Note 9 ). Further procedure and microscope settings depend on the type of measurement with regard to cellular Ca2+ signals.
3.3 Recording Global Cellular Ca2+ Transients
-
1.
If global events, whole cell Ca2+ transients, have to be recorded, apply a fast x-y scan mode with reduced number of x-y pixels (e.g., a square ROI encompassing the cell is 250 × 250 or 125 × 125 pixels) (Fig. 2). However, if available, fast and sensitive cameras, instead of the photomultipliers we use in our setup, can also be used for this purpose. Please see details regarding our global Ca2+ transient recording settings in the legend of Fig. 2.
Fig. 2 
Recording of global cellular Ca2+ transients in human iPS-CMs. Spontaneous global cellular Ca2+ transients of hiPSC-CMs expressing either wild type RyR2 (top) or the patient-derived CPVT-mutant RyR2F2483I (bottom), recorded under the fast x-y scanning mode of the FluoView1000 confocal microscope. Cells were loaded with 5 μM Fluo-4 and excited with the 488 nm argon line at 0.3 % laser intensity, emission was measured using the BA505IF long-pass filter. The photomultiplier voltage was set to 700 V, the confocal aperture was 350 μm. Under the 60× oil objective (numerical aperture of the objective: 1.35), square ROIs were chosen, encompassing the shown iPS-CM (note: only a rectangular cut-out of the original square ROIs is shown in the figure). The square ROIs had the dimensions of 256 × 256 pixels, corresponding to 33.4 × 33.4 μm (~130 nm/pixel). The sampling speed was 0.5 μs/pixel and 15.4 frames/s were recorded in the roundtrip-mode. Data were 12 bit digitized, no averaging was applied. With these settings, the spatial as well as the temporal resolution is sufficiently high to measure and compare global Ca2+ events. It also allows detection of local irregularities, as shown in the example of mutant cells heterozygous for RyR2F2483I mutation (see inset in the bottom part of the figure). This cell shows a locally restricted Ca2+ release that follows almost every global Ca2+ transient. In the context of the whole organ, the heart, such events could electrically destabilize the CMs and provoke arrhythmic events. The recorded data can be analyzed (upon background fluorescence intensity subtraction) in terms of amplitude, duration and frequency, for instance, using the same software which was used for recording (Olympus FluoView in our system). However, our software (and also the software of microscope systems from other companies) supports the export of the recorded transients into Excel for a more elaborate analysis
-
2.
With the recording mode described in Fig. 2, the impact of toxic or pharmacological substances on Ca2+ transients can be investigated. This is shown in Fig. 3 for the effect of the RyR2 blocker ryanodine and the beta adrenergic agonist ISO, on spontaneous global Ca2+ transients of iPS cells. It is important to ensure a rapid and complete solution exchange while avoiding cell detachment and their subsequent loss. The optimal flow intensity during pipetting for solution changes is a matter of experience. However, to obtain an idea of the flow intensities during a solution change, one can visually control the cells while he/she or a colleague is performing the pipetting. Practically, we are using the turbulences created during the solution change to mark the exact beginning of the solution change within the field of view. These turbulences are made visible during the measurement by activating, in addition to the regular channel used for recording Fluo-4 fluorescence, the transmitted light (i.e., transmission of 488 nm plus Fluo-4 emission) channel in the DIC mode. However, the x-y mode of our microscope system is not fast enough to allow for appropriate recording and analysis of Ca2+ release events with faster kinetics, like fast Ca2+ waves and Ca2+ sparks. For this purpose, we use the line-scan mode described below.
Fig. 3 
The effect of 1 mM ryanodine (a) or 1 μM ISO (b) on spontaneous Ca2+ transients in human iPS-CMs. The experimental conditions are as described in Fig. 2. As can be seen in panel a, the addition of 1 mM ryanodine, a concentration high enough to completely block SR Ca2+ release via RyR2 (see Note 4 ), decreases the amplitude and frequency of Ca2+ transients, but does not completely abolish the spontaneous Ca2+ transients in iPS-CMs, even under prolonged (≥10 min) incubation. The inability of ryanodine to completely block the Ca2+ transients is probably due to the presence of significant amounts of IP3 receptors, which can release Ca2+ from internal stores (for comparison see also Fig. 4a in ref. 18). As shown in panel b, the addition of 1 μM ISO has a modest effect on the frequency and virtually no effect on the amplitude of spontaneous Ca2+ transients in human iPS-CMs. In this example, the frequency was increased from eight transients per 20 s to ~10 transients per 20 s (however, compare to Fig. 4b in ref. 31)


3.4 Recording Local Ca2+ Release Events
-
1.
For recording and analysis of local events, e.g., Ca2+ wavelets and Ca2+ sparks, operate the scanner in the line scan mode, i.e., it rapidly moves back and forth multiple times along the same trajectory, which has been defined before by the experimenter (e.g., between points a and b in Fig. 4). Thus, it rapidly reports changes in fluorescence intensity over time, along a defined, very narrow x-y cell slice. However, this highly repetitive event exposes the scanned region to photon stress and can often lead to a decrease in signal intensity due to fluorophore bleaching and/or to irreversible cell damage, often indicated by cessation of spontaneous beating and/or by cell contracture.
Fig. 4 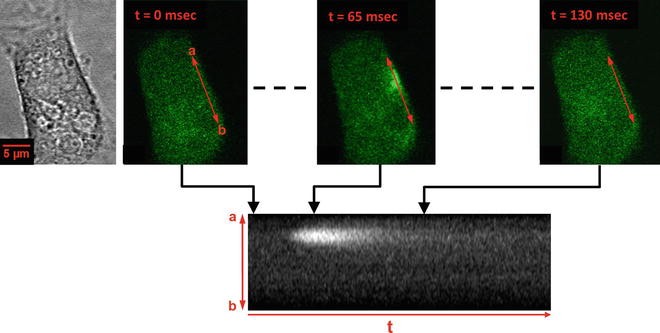
Local Ca2+ release events recorded in the line scan mode. Shown is the same patient-derived iPS-CM heterozygously expressing the CPVT-mutant RyR2F2483I as in the bottom panel of Fig. 2. The panel on the left shows an intact and spontaneously beating (not perceptible in this representation) cell in x-y scan in the transmission mode under 60× oil. Fluorescence images in the upper panel show a cell after Fluo-4 loading, at different time points during diastole (from left to right: 0, 65 and 130 ms). The three ordinary x-y scans were recorded at different times, and are only shown to demonstrate the position of the scanned line relative to the cell and to demonstrate a spatially and temporary restricted Ca2+ release event (see the signal at t = 65 ms)
-
2.
To decrease severity of these effects, operate the laser at the lowest possible intensity (often at 0.1–0.3 % setting of the 488 nm argon line). Depending on how frequently the recorded Ca2+ events occur, the duration of a particular line scan can be set from 2 s to >10 s, but a recording period longer than 10 s is not recommended. Figures 4 and 5 show examples of data which have been obtained under the line scan mode.
Fig. 5 
Line scans enable resolving the frequency, the subcellular origin, and the time course of local Ca2+ release events. In this example, CPVT patient-derived iPS-CMs expressing mutant RyR2 (RyR2F2483I), loaded with Fluo-4 have been used. CMs were from culture day 20. Upper left panel: regular x-y scan, showing the position of the line scan to be performed (red line). Note the presence of multiple fluorescent stripes along the x scanning direction. This “smear” in x direction reflects local Ca2+ release events, which are crossed by the scanner while performing the fast x part of an ordinary x-y scan. a and b mark the two points between which the line scan is performed (distance between points: 100 μm). Right panel: Scan along the line between points a and b. The scanned 100 μm correspond to 253 pixels (=414 nm/pixel under the chosen dimensions). Total recording time (t) was 5.89 s. Multiple local Ca2+ releases can be seen, the one highlighted by the red rectangle very likely appears repetitively from the same release site. Note that the release sites are not random and that most releases emerge repetitively from the same sites. Lower left panel: Graphical representation of the time course, spatial extension and Fluo-4 fluorescence intensity of a marked release event. Kinetic analysis involves, among other parameters, the time-to-peak value (ttp)
-
3.
Adjust the focus manually to obtain maximum intensity readout (try to do this as quickly as possible to prevent prolonged exposure of the cell to the laser).
-
4.
Then, perform a single x-y scan with a 256 × 256 pixel resolution. In the microscope software menu, switch to the line scan mode, and use the last x-y scan picture to draw a line along a distance x (from point a to point b), along which you want to perform the line scan. This line is shown in red in Figs. 4 and 5. This line is usually in the range between 20 and 100 μm in length. Often, but not always, regions close to the edges of the cell, as in this example, are more likely to display local Ca2+ release events at high frequency.
-
5.
Then, define how often the scanner has to measure the intensity along the defined line. In our system, to record local Ca2+ release over a distance x of ~35 μm and for a period t of 8 s, approximately 33,000 lines scans were performed. Thus, each pixel intensity along the line x can be recorded every 244 μs, i.e., 4/ms. This temporal resolution is high enough to record Ca2+ sparks, which typically last in differentiated CMs for about 40 ms (half time of fluorescence decay ~25 ms [32]).


3.5 Analysis of Recordings
-
1.
With regard to analysis, one should consider that in contrast to ratiometric determination of Ca2+ absolute concentrations (such as for example with the Ca2+ indicator Fura), Fluo-4 imaging is, in most cases, not used to report absolute concentrations of [Ca2+]i. Rather, changes in [Ca2+]i are recorded with Fluo-4 as changes (ΔF) of basal fluorescence intensity (F 0). Thus, already the non-stimulated cell will have a measurable Fluo-4 baseline fluorescence intensity F 0, which corresponds to a [Ca2+]i of ~100 nM (see Note 10 ). To quantify a recorded Ca2+ event, the Fluo-4 intensity during this event, F, is related to F 0, in our lab with the quotient (F − F 0)/F 0. However, others often use the quotient F/F 0, the only difference being that the latter value is higher by a unity. Therefore, one should clearly describe how the fluorescence intensity data have been quantified.
-
2.
An important factor in this respect is the background intensity. Care must be taken to remove the background reading of the photomultiplier (see Note 11 ). A mild data filter procedure (e.g., 3 × 3 pixel averaging), included in most confocal microscopy software, can be applied to decrease the unavoidable noise in fast measurements under low excitation intensity, without affecting kinetics of the recordings. However, one should always save the original data, i.e., still containing the background and not yet filtered.
-
3.
The parameters we use most frequently for analysis of background-corrected and filtered, global and local Ca2+ transients are the maximum value for (F −F 0)/F 0, which is the amplitude, (F max − F 0)/F 0, and the Full Duration at Half Maximum (FDHM).
-
4.
There are several ways to calculate the amplitude and FDHM. One possibility is to use the interactive 3D surface plot plugin of ImageJ, open access graphic analysis software which can be downloaded from the NIH internet pages (http://imagej.nih.gov/ij/). For analysis, the original image is transferred to ImageJ, e.g., by copying it to the clipboard of the operating system and pasting it into ImageJ. An example for the analysis of a local Ca2+ transient, recorded under the line scan mode, is shown in Fig. 6.
Fig. 6 
An example for analysis of a local Ca2+ release event recorded in a human iPS-CM. CMs heterozygously expressing the CPVT mutant RyR2F2483I were loaded with 5 μM Fluo-4 and local Ca2+ release events recorded in the line scan mode. The local transient shown in the bottom x-t scan (=line scan) was recorded with a frequency of 4 lines/ms, was background-corrected and filtered by 3 × 3 pixel-average (Olympus FluoView software). The picture was then transferred to ImageJ and analyzed using the interactive 3D surface plot plugin of ImageJ. The visually determined values in the example shown in this figure are 190 arbitrary units (a.u.), 70 a.u. and 33 ms for F max, F 0 and FDHM, respectively. The calculated amplitude, (F max − F 0)/F 0, is calculated as (190 − 70)/70 and has the value of 1.7
-
5.
Pay attention to the following important aspects of analysis to ensure correctness of analysis and enable correct comparison of transients recorded from different iPS-CMs. First, the x-axis (= time scale) created by ImageJ does not have the same units (ms) as the original line scan, but can be easily converted into ms by relating ImageJ x-values to the duration (in ms) of the exported line scan segment. Second, the same settings should always be used in the ImageJ plugin when analyzing and comparing different data sets. Particularly, smoothing in the ImageJ analysis plugin should be kept as low as possible (not exceeding the value 10), and should be kept constant. After readout of F max, F 0, and FDHM by the user, the plot should be saved.
-
6.
Another possibility to analyze the transients is to export the line scan data to a spreadsheet application, such as Excel, where (F max − F 0)/F 0 and FDHM can be calculated easily by applying a few custom made macros. For a more extensive analysis of local Ca2+ release recordings, especially for Ca2+ sparks, the Bers lab developed a freely available ImageJ Plugin, SparkMaster [33]. In addition to amplitude and FDHM, the routine automatically also calculates FWHM, Full Width, Full Duration, Time-to-Peak, maximum steepness of spark upstroke, and the time constant of spark decay (for download please see: https://sites.google.com/site/sparkmasterhome/). For successful use of SparkMaster it is important to have data with an acceptable signal to noise ratio and that the appropriate criteria are defined (e.g., the minimum size of an event which should be recognized as spark and taken for analysis).

4 Notes
-
1.
A 5× stock can be prepared and sterile filtered (0.2 μm) upon pH adjustment. The stock can be aliquoted as 5 ml aliquots in 50 ml sterile Falcon tubes and kept at ≤4 °C for several weeks. Before use of a 5 ml aliquot, always check for precipitates and floating material while shaking the tube. Discard and prepare fresh solution if necessary. For a 5× stock solution weight the following quantities of chemicals (in g/l): NaCl 40.908, MgCl2 × 6H2O 1.017, KCl 2.013, CaCl2 × 2H2O 1.470, d-glucose 9.010, sodium pyruvate 1.100, and HEPES 11.915.
-
2.
Make sure to order the acetoxy-methyl-ester of Fluo-4 (Fluo-4 AM). The Fluo-4 ester will enter the cells and will be trapped inside them upon de-esterification. However, under prolonged duration of an experiment (>1–1.5 h after Fluo-4 loading) the Fluo-4 dye accumulation in subcellular compartments will become significant, visible as high-intensity fluorescent dots. This will increase the amount of background fluorescence with no or complex contribution to the Ca2+ signal.
-
3.
Using 10 mM caffeine for SR Ca2+ store emptying might be sufficient for stationary caffeine concentrations, as used in experiments described in this protocol. The required caffeine concentrations may be considerably higher when applying caffeine via so-called Ca2+ puffs (see, for instance, ref. 18).
-
4.
Low ryanodine concentrations, in the low μM to nM range [26], have partially opposite effects, i.e., RyR can be activated. Thus, although the supplier’s (Tocris) product information sheet states that ryanodine is a potent inhibitor of Ca2+ release from SR, the IC50 values listed there for ryanodine, 10 and 2.8 nM for skeletal and cardiac RyR, respectively, refer to the high affinity, activating binding site(s) on the RyR. Thus, only ryanodine working concentrations >100 or 200 μM should be used to achieve complete RyR inhibition.
-
5.
However, the glass bottom of the glass bottom dishes which is glued to the surrounding plastic bottom creates a reservoir for medium/solution, preventing fast drying out of the cells. We measured the thickness of the plastic bottom, it amounts to ~0.47 mm. With a diameter of the glass bottom of ~13.3 mm, the volume of this reservoir is about 65 μl (assuming an even solution surface). Technically, this residual volume in the glass bottom is a dead volume, decreasing the nominal concentration of a substance (caffeine for instance) by ~6.1 % when the exchanged volume is 1 ml. During the wash steps, do not direct the flow of the rinsing solution towards the cells, since they will detach and will be lost.
-
6.
Fluo-4 loading of cells can be enhanced by addition of the non-ionic detergent Pluronic® F-127 (Life Technologies): For that purpose, the Fluo-4 AM stock aliquot is mixed with an equal volume of 20 % (w/v) Pluronic in DMSO, followed by dilution into the measuring solution. However, we achieve satisfactory levels of Fluo-4 AM loading in the absence of Pluronic when using 5 μM working concentration of the Ca2+ indicator.
-
7.
Under visual examination of cells using mercury bulb excitation and the GFP filter set, successful Fluo-4 loading will be indicated by green fluorescing cells with a more or less similar intensity. However, very bright cells should be excluded from measurements, because they are very likely damaged and have a Ca2+ overload.
-
8.
Any illumination/filter setting which is suited for EGFP or FITC can be used. We recommend using a 505–525 nm band pass filter for measurements. However, if no other fluorophore besides Fluo-4 is used in the experiments, like, for instance, fluorescent membrane stain CellMask® orange, a 505 long pass filter can be used which will give a stronger signal.
-
9.
We manually set a confocal aperture (c.a., or pinhole diameter) almost twice as high as the value recommended by the software for the 60× oil, i.e., from a c.a. of 105 μm to a c.a. between 150 and 300 μm, or up to 350 μm for thick cells. Higher values will also bring more out-of-focus, unrelated signal into the measurement and can be counterproductive. However, one has to determine her/his own compromise between intensity and spatial resolution.
-
10.
For further helpful information on Fluo-4 properties (e.g., compartmentalization) and for an extensive comparison of various fluorescent Ca2+ indicators we recommend the ref. [34].
-
11.
Part of the measured fluorescence intensity F upon illumination of cells with the 488 nm argon line will not originate from Fluo-4 emission but will be due to autofluorescence. This background can be significant and has to be removed, as described in the following example: let us assume that the background intensity is 200 (fluorescence intensity, arbitrary units). If now a F 0 of 600 is measured and F max of 1800, then, when the background is not subtracted (from both, F 0 and F max), the quotient (F max − F 0)/F 0 will amount to 2. However, when the background is subtracted, it will give the correct value of 4, which is twofold higher! The lower the Fluo-4 signal intensity, the higher this error will be. To correct for this unwanted contribution, in principle, one could determine the background intensity before loading the cells with Fluo-4 AM, by exciting the unloaded cell with the 488 nm argon line and recording the emission intensity. However, the actual argon laser intensity which will be used after Fluo-4 loading of the cells for the experiment is variable, and so will be the background intensity. Thus, we determine the background intensity for every measurement after performing the scans, by measuring the average intensity within a cell-free region and by subtracting this value from all pixels of the scan.
References
Roger VL, Go AS, Lloyd-Jones DM et al (2012) Executive summary: heart disease and stroke statistics-2012 update: a report from the American Heart Association. Circulation 125:188–197
Watanabe H, Yang T, Stroud DM, Lowe JS, Harris L, Atack TC et al (2011) Striking in vivo phenotype of a disease-associated human SCN5A mutation producing minimal changes in vitro. Circulation 124:1001–1011
Kaese S, Verheule S (2012) Cardiac electrophysiology in mice: a matter of size. Front Physiol 3:345
MacRae CA (2013) Recent advances in in vivo screening for antiarrhythmic drugs. Expert Opin Drug Discov 8:131–141
Verkerk AO, Remme CA (2012) Zebrafish: a novel research tool for cardiac (patho)electrophysiology and ion channel disorders. Front Physiol 3:255
Grskovic M, Javaherian A, Strulovici B, Daley GQ (2011) Induced pluripotent stem cells-opportunities for disease modelling and drug discovery. Nat Rev Drug Discov 10:915–929
Cheng H, Lederer WJ (2008) Calcium sparks. Physiol Rev 88:1491–1545
Gorski PA, Ceholski DK, Hajjar RJ (2015) Altered myocardial calcium cycling and energetics in heart failure—a rational approach for disease treatment. Cell Metab 21:183–194
Lou Q, Janardhan A, Efimov IR (2012) Remodeling of calcium handling in human heart failure. Adv Exp Med Biol 740:1145–1174
Zhang XH, Haviland S, Wei H, Saric T, Fatima A, Hescheler J et al (2013) Ca(2+) signaling in human induced pluripotent stem cell-derived cardiomyocytes (iPS-CM) from normal and catecholaminergic polymorphic ventricular tachycardia (CPVT)-afflicted subjects. Cell Calcium 54:57–70
Zhang GQ, Wei H, Lu J, Wong P, Shim W (2013) Identification and characterization of calcium sparks in cardiomyocytes derived from human induced pluripotent stem cells. PLoS One 8, e55266
Lundy SD, Zhu WZ, Regnier M, Laflamme MA (2013) Structural and functional maturation of cardiomyocytes derived from human pluripotent stem cells. Stem Cells Dev 22:1991–2002
Rao C, Prodromakis T, Kolker L, Chaudhry UA, Trantidou T, Sridhar A et al (2013) The effect of microgrooved culture substrates on calcium cycling of cardiac myocytes derived from human induced pluripotent stem cells. Biomaterials 34:2399–2411
Nunes SS, Miklas JW, Liu J, Aschar-Sobbi R, Xiao Y, Zhang B et al (2013) Biowire: a platform for maturation of human pluripotent stem cell-derived cardiomyocytes. Nat Methods 10:781–787
Li S, Chen G, Li RA (2013) Calcium signaling of human pluripotent stem cell-derived cardiomyocytes. J Physiol 591(Pt 21):5279–5290
Lee YK, Ng KM, Lai WH, Chan YC, Lau YM, Lian Q et al (2011) Calcium homeostasis in human induced pluripotent stem cell-derived cardiomyocytes. Stem Cell Rev 7:976–986
Liu J, Fu JD, Siu CW, Li RA (2007) Functional sarcoplasmic reticulum for calcium handling of human embryonic stem cell-derived cardiomyocytes: insights for driven maturation. Stem Cells 25:3038–3044
Itzhaki I, Rapoport S, Huber I, Mizrahi I, Zwi-Dantsis L, Arbel G et al (2011) Calcium handling in human induced pluripotent stem cell derived cardiomyocytes. PLoS One 6, e18037
Fatima A, Xu G, Shao K, Papadopoulos S, Lehmann M, Arnaiz-Cot JJ et al (2011) In vitro modeling of ryanodine receptor 2 dysfunction using human induced pluripotent stem cells. Cell Physiol Biochem 28:579–592
Yazawa M, Hsueh B, Jia X, Pasca AM, Bernstein JA, Hallmayer J et al (2011) Using induced pluripotent stem cells to investigate cardiac phenotypes in Timothy syndrome. Nature 471:230–234
Itzhaki I, Maizels L, Huber I, Gepstein A, Arbel G, Caspi O et al (2012) Modeling of catecholaminergic polymorphic ventricular tachycardia with patient-specific human-induced pluripotent stem cells. J Am Coll Cardiol 60:990–1000
Jung CB, Moretti A, Mederos y Schnitzler M, Iop L, Storch U, Bellin M et al (2012) Dantrolene rescues arrhythmogenic RYR2 defect in a patient-specific stem cell model of catecholaminergic polymorphic ventricular tachycardia. EMBO Mol Med 4:180–191
Prasad AM, Inesi G (2012) Analysis of calcium transients in cardiac myocytes and assessment of the sarcoplasmic reticulum Ca2+-ATPase contribution. Methods Mol Biol 798:411–421
Whitaker M (2010) Genetically-encoded probes for measurement of intracellular calcium. Methods Cell Biol 99:153–182
Dolnikov K, Shilkrut M, Zeevi-Levin N, Gerecht-Nir S, Amit M, Danon A et al (2006) Functional properties of human embryonic stem cell-derived cardiomyocytes: intracellular Ca2+ handling and the role of sarcoplasmic reticulum in the contraction. Stem Cells 24:236–245
Buck E, Zimanyi I, Abramson JJ, Pessah IN (1992) Ryanodine stabilizes multiple conformational states of the skeletal muscle calcium release channel. J Biol Chem 267:23560–23567
Mummery C, Ward-van Oostwaard D, Doevendans P, Spijker R, van den Brink S, Hassink R et al (2003) Differentiation of human embryonic stem cells to cardiomyocytes: role of coculture with visceral endoderm-like cells. Circulation 107:2733–2740
Burridge PW, Keller G, Gold JD, Wu JC (2012) Production of de novo cardiomyocytes: human pluripotent stem cell differentiation and direct reprogramming. Cell Stem Cell 10:16–28
Lian X, Zhang J, Azarin SM, Zhu K, Hazeltine BL, Bao X et al (2013) Directed cardiomyocyte differentiation from human pluripotent stem cells by modulating Wnt/β-catenin signaling under fully defined conditions. Nat Protoc 8:162–175
Correia C, Serra M, Espinha N, Sousa M, Brito C, Burkert K et al (2014) Combining hypoxia and bioreactor hydrodynamics boosts induced pluripotent stem cell differentiation towards cardiomyocytes. Stem Cell Rev 10:786–801
Kim JJ, Yang L, Lin B, Zhu X, Sun B, Kaplan AD et al (2015) Mechanism of automaticity in cardiomyocytes derived from human induced pluripotent stem cells. J Mol Cell Cardiol 81:81–93
Cheng H, Lederer MR, Lederer WJ, Cannell MB (1996) Calcium sparks and [Ca2+]i waves in cardiac myocytes. Am J Physiol 270:C148–C159
Picht E, Zima AV, Blatter LA, Bers DM (2007) SparkMaster: automated calcium2 spark analysis with ImageJ. Am J Physiol Cell Physiol 293:C1073–C1081
Thomas D, Tovey SC, Collins TJ, Bootman MD, Berridge MJ, Lipp P (2000) A comparison of fluorescent Ca2+ indicator properties and their use in measuring elementary and global Ca2+ signals. Cell Calcium 28:213–223
Acknowledgements
This work was supported by a grant from the Köln Fortune program of the University Hospital of Cologne to A.W. and S.P. (Grant Number: KF2680129201) and Federal Ministry for Education and Research (BMBF) to T.Š. and J.H. (01GN0824).
Author information
Authors and Affiliations
Corresponding authors
Editor information
Editors and Affiliations
Rights and permissions
Copyright information
© 2015 Springer Science+Business Media New York
About this protocol
Cite this protocol
Walter, A., Šarić, T., Hescheler, J., Papadopoulos, S. (2015). Calcium Imaging in Pluripotent Stem Cell-Derived Cardiac Myocytes. In: Nagy, A., Turksen, K. (eds) Patient-Specific Induced Pluripotent Stem Cell Models. Methods in Molecular Biology, vol 1353. Humana Press, New York, NY. https://doi.org/10.1007/7651_2015_267
Download citation
DOI: https://doi.org/10.1007/7651_2015_267
Published:
Publisher Name: Humana Press, New York, NY
Print ISBN: 978-1-4939-3033-3
Online ISBN: 978-1-4939-3034-0
eBook Packages: Springer Protocols